


This chapter is about death. Throughout the book, we’ve been steadily zooming out, both in space and in time, to consider human identity from an increasingly holistic perspective. Now, it’s time to connect the observations about sexuality, urbanization, identity, and politics to the longer arc of human population growth, and that means exploring the balance between reproduction and mortality. Shifts in that balance over time are both caused by and drive the most dramatic changes we’re undergoing, as a species and as a planet. Those shifts have brought us to an unprecedented tipping point: a time of great sensitivity to small differences, when a nudge this way or that could take us to very different futures.

Let’s begin by considering where babies come from—not anatomically, but geographically! Recall that Americans are having fewer children today than it would take to replace the population from one generation to the next (see Chapter 5). This is especially true in the city, where the number of births drops precipitously. Partly, this is because cities skew toward younger people. There are likely a number of reasons; one is the American tradition in which couples move to the suburbs to have kids.
However, even considering only the number of children born to post-menopausal women (I’ve picked ages 44–64), the contrast between rural and urban fertility is stark. 1 Below about 100 square meters per person, women average fewer than one child. Below about 1,000 square meters per person, the threshold above which most people think of themselves as living in the suburbs, the figure is 1.5 or fewer. Only at the most rural extreme, around 100,000 square meters per person, does the number of children per female, normally called the “total fertility rate” or TFR, approach replacement rate, which is about 2.1 in the developed world. 2
There’s an obvious and striking conclusion here: cities are not even remotely demographically self-sustaining. They’re population sinks. Not only must they draw on the material resources of the countryside to survive; they also need a continual influx of young people from elsewhere. Without immigration, a city will age rapidly and then collapse, like a star running out of nuclear fuel to burn.
Replacement TFR isn’t exactly two because women and men aren’t born in precisely equal proportions, and more importantly, because early deaths before or during a person’s fertile years have to be taken into account. Without modern medicine, replacement TFR is well above two, as infant and childhood mortality are especially high. (While this factor isn’t generally considered, I think that in advanced economies, a good deal of the excess above two is also due to the not so tiny percentage of intersex children! 3 )
In any case, in a closed community with no immigration or emigration, constant mortality, and a TFR of precisely the replacement rate, a population’s size will remain constant. If the potential mothers average fewer than two children each over their reproductive years, the population will shrink exponentially; if they have more than two-point-something children on average, it will grow exponentially. Replacement rate represents a knife’s edge between exponential growth and exponential decline. Unless actively maintained somehow, stability is elusive.
To get a sense of how elusive, let’s do some rough calculations. Assume for the moment that a “generation” is 30 years, and for simplicity’s sake, let’s pretend that replacement TFR is precisely two, ignoring premature mortality and other corrections. Then, under steady conditions, a total fertility rate of 5, which was roughly the world average from 1950–1970, 4 leads to a doubling of the population every 23 years or so. Over a century, population would grow by 21-fold! Such calculations offer some perspective on sensational book titles of that era, like The Population Bomb (1968). 5
On the other hand, a TFR of one, as we see in the densest ZIP codes, works out to a halving of the population every 30 years; or, a TFR of 1.5 works out to a halving every 72 years, and a drop to 10% of the original population size after 240 years. At that rate, 2,300 years from now, only two people would be left. 6 Compared to human history so far, which extends back hundreds of thousands of years, 2,300 years is no time at all.
Given the runaway logic of exponential growth or decline, it may seem astonishing that we’re still around after so many millennia. How could we have stayed balanced on the knife’s edge for such a long time? It seems that either we should have gone extinct long ago, or our numbers should have exploded until we suffered a die-off from overpopulation, at which point, presumably, the cycle would repeat.
It’s the second. This is, in fact, how life works in general. Historically, human population has been subject to the same dynamics as any other animal on Earth: We’ve mated and produced offspring, or tried to, at a healthy clip—well above replacement, for otherwise we’d continually teeter on the brink of extinction. Our reproductive powers are not as impressive as those of some species (a male seahorse releases up to 1,000 young), but we’re certainly capable of explosive growth—much more so than our primate cousins, the chimpanzees and bonobos, for whom nursing and infancy are more protracted due to a lack of alloparental help (see Chapter 4).
The country with the highest current fertility rate, Niger, has a TFR of nearly 7. That works out to a population doubling time of 17 years. Unchecked, such high fertility would mean rapid exponential growth, and a planet stacked neck deep with human bodies—literally—in a couple of dozen generations. In the past, that hasn’t happened for the same reasons the planet isn’t stacked neck deep with any other animal: malnutrition and starvation, disease, violence, and predation.

In 1798, the English Reverend Thomas Robert Malthus (1766–1834) published just this observation in his famous Essay on the Principle of Population, noting how fundamental a force such miseries have been in shaping our numbers over time:
Population, when unchecked, increases in a geometrical ratio. Subsistence increases only in an arithmetical ratio. 7 A slight acquaintance with numbers will shew the immensity of the first power in comparison of the second.
By that law of our nature which makes food necessary to the life of man, the effects of these two unequal powers must be kept equal.
This implies a strong and constantly operating check on population from the difficulty of subsistence. This difficulty must fall somewhere and must necessarily be severely felt by a large portion of mankind. 8
Put this way, it’s a bleak but basic observation; yet it came as a shock to many of his readers. Why did it take until 1798 for someone to notice this?

It turns out that others were, in fact, making the same observation around the same time, seemingly independently. Five years earlier, unbeknownst to Malthus, Chinese scholar Hong Liangji (洪亮吉) had written the essays “Reign of Peace” and “Livelihood,” sounding a similar alarm about overpopulation:
Some may ask: Do Heaven and Earth have remedies? The answer is that their remedies are in the form of flood, drought, sicknesses, and epidemics. But those unfortunate people who die from natural calamities do not amount to more than 10 or 20 percent of the population.
Some may ask: Does the government have remedies? The answer is that its methods are to exhort the people to develop new land, to practice more intensive farming, to transfer people from congested areas to virgin soils, to reduce the fiscal burden, to prohibit extravagant living and the consumption of luxuries, to check the growth of land-lordism, and to open all public granaries for relief when natural calamities strike […]. In short, during a long reign of peace Heaven and Earth could not but propagate the human race, yet their resources that can be used to the support of mankind are limited. During a long reign of peace the government could not prevent the people from multiplying themselves, yet its remedies are few. 9

The timing wasn’t coincidental. Consider the preconditions for a Hong Liangji or Thomas Malthus to make and pass on the observations they did on exponential population growth and the role of starvation in limiting it:
Literacy.
The leisure to ponder and write treatises, and an intelligentsia to read them.
Enough knowledge of math to understand exponential growth and its “immensity” in comparison to any finite limit.
Observation of exponential population growth within their own lifetimes.
Observation of starvation at work to limit the population.
Before looking more closely into why scholars on opposite sides of the world might have ticked all five boxes for the first time at the close of the 18th century, let’s consider the situation today. Despite persistent social inequities, a majority of 21st century Americans meet the first four conditions—including many who work multiple jobs and didn’t go to college. Literacy and numeracy are widespread, most of us have enough leisure to spend hours daily watching TV or scrolling through social media, and we’ve seen extraordinary rises in population within our lifetimes. Almost no Americans today tick the fifth box, though, since starvation and child mortality are no longer significant forces keeping the US population in check. It’s telling that poverty in much of the modern world correlates with obesity rather than skinniness.
Until very recently, conditions could not have been more different. The website Our World in Data is a great resource for demographic data and analysis, and offers a startling historical perspective on extreme poverty.
What counts as “extreme poverty” is a subject of intense debate (like the terms “city” and “countryside,” it has no objective definition), but the scale of this worldwide transition over the past 200 years is breathtaking, no matter where the line is drawn. If you live in extreme poverty, that means, in practice, your time and energy throughout the day are spent in a struggle to get enough calories to survive and reproduce.
There are still people in the world living under such conditions, but not only are they a minority; fewer people, in absolute numbers, live in extreme poverty than in 1820, when our population was one eighth of its size today. Back in 1820—and at every time up until then, to the best of our knowledge—the overwhelming majority of human beings lived in extreme poverty.
All of which is to say: Thomas Malthus and Hong Liangji were privileged members of tiny elites in their respective countries with the leisure and education to do the kind of scholarship that got them Wikipedia entries a couple of centuries later. At the same time, neither they nor their (also privileged) readers had to venture far from the front gates of their estates to encounter the other 99%—a population that had begun to grow explosively, yet was still visibly constrained by starvation and other “positive checks,” as Malthus calls them:
The positive check to population, by which I mean the check that represses an increase which is already begun, is confined chiefly, though not perhaps solely, to the lowest orders of society.
[…] I believe it has been very generally remarked by those who have attended to bills of mortality that of the number of children who die annually, much too great a proportion belongs to those who may be supposed unable to give their offspring proper food and attention, exposed as they are occasionally to severe distress and confined, perhaps, to unwholesome habitations and hard labour. […] [It] seems difficult to suppose that a labourer’s wife who has six children, and who is sometimes in absolute want of bread, should be able always to give them the food and attention necessary to support life. The sons and daughters of peasants will not be found such rosy cherubs in real life as they are described to be in romances. It cannot fail to be remarked by those who live much in the country that the sons of labourers are very apt to be stunted in their growth, and are a long while arriving at maturity. Boys that you would guess to be fourteen or fifteen are, upon inquiry, frequently found to be eighteen or nineteen. And the lads who drive plough, which must certainly be a healthy exercise, are very rarely seen with any appearance of calves to their legs: a circumstance which can only be attributed to a want either of proper or of sufficient nourishment. 10

Such conditions date back a long way. With malnutrition and disease keeping the death rate up—especially among children, who are the most vulnerable—being an average parent in virtually any premodern agricultural society would have been very different from parenthood in the US today. It would have been a parade of loss and grief; perhaps also, out of necessity, a time of less emotional investment in the lives of individual children. That’s why, in many traditional cultures, babies aren’t even named until they make it to a certain age. 11 It’s remarkable that we can now assume that every child will grow to adulthood, and that it’s such an unexpected shock when that doesn’t happen. This is a consequence of recent medical and social technologies having disarmed Malthus’s “positive checks.”

By “medical technologies,” I don’t so much mean MRIs and bone marrow transplants, but the basics, like safer childbirth, hygiene, antibiotics, and vaccines. By “social technologies,” I mean the laws, norms, and institutions that greatly reduce the murder rate, make honor killings unacceptable, provide a basic level of universal food, clothing, and shelter, and in other ways prevent many of the deaths that would have happened in an earlier era.
To be sure, none of these benefits are fully universal, let alone fairly distributed. Black infants in America, for instance, are more than twice as likely to die before their first birthday as white infants. 12 However, none of these discrepancies even approaches normal conditions in Malthus’s day, when childhood mortality was magnitudes higher for everyone, nobles and peasants alike.
Still, by the 18th century, positive checks on population had started to lift, and the ensuing population explosion became suddenly obvious. The same was happening in Qing Dynasty China; per Hong Liangji,
Our society has been stable for more than a hundred years. In terms of the number of households, it is five times more than thirty years ago, ten times more than six decades ago and twenty times more than a hundred years ago […]. Farms and houses are always scarce, and they are not enough for the excessive population growth […]. Floods, droughts, and plagues are the means Heaven uses to mitigate the tension. 13
To put this population growth in context, we’ll need to look at long-term historical data. What follows is necessarily simplified, and the numbers involve guesswork as we venture deep into the past, but the outlines of the story are clear and uncontested.
Beginning with a zoomed-out view of the world’s total population since the dawn of agriculture, we see something that barely looks like a graph at all. It’s more like a flat line indistinguishable from zero, followed by a near-vertical spike at the very end. Entrepreneurs like to fantasize about “hockey stick” plots showing money or customers growing slowly, then exploding upward; this is the mother of all hockey sticks.
Making sense of it requires a logarithmic population axis. Seen this way, an exponential increase over time looks like a straight line, where the slope of the line measures the growth rate.
Even on a logarithmic scale, there’s a leap upward near the end of the timeline, but now we can see that what looked like a flat line over the 10,000+ years during which increasing numbers of humans began to practice traditional agriculture was already characterized by steady exponential growth. Despite being invisible on a linear scale because the population was so much smaller than today’s, during those 10,000 years, our numbers grew about 70-fold.
Was traditional agriculture in itself a significant positive-check-eliminating technology? This turns out to be a tricky question. Clearly agriculture supplied enough calories for the population to grow 70 times larger than it had been under the hunting and gathering regime, but as Malthus points out, driving the plough by hand and eating the produce from your traditional family farm won’t put a lot of meat on your calves. This is true even without accounting for the levies imposed on peasants by the patriarchal warlords, headmen, clergy, or nobility that tend to parasitize 14 agricultural societies.

A convincing case has been made that the hunter-gatherer lifestyle was healthier—at least, for the survivors—than subsistence farming. 15 The diets and activities of most hunter-gatherers were varied, they had plenty of time for art and leisure, and their social structures tended to be quite egalitarian.
On the other hand, while our hunter-gatherer ancestors might have been physically impressive in adulthood, they suffered high infant and childhood mortality. Moreover, high mortality (by any modern standard) continued into adulthood due to violence, accidents, infections, and the dangers of childbirth. Less depressingly, prolonged breastfeeding, common among hunter-gatherers, suppressed women’s fertility; we’ll get to the birth control side of the population equation in the next chapter. My point here, though, is that death was a constant stalker. Even strong, healthy adults walked a tightrope of positive checks, and could die suddenly of myriad causes. We know this, in part, because that same mortal precarity still holds among the few remaining traditional hunter-gatherer societies today. 16


Farming got started after the last Ice Age ended, the glaciers retreated, and Earth’s climate entered a long, stable, mild period. Newly exposed fertile soils could support subsistence agriculture, enabling higher population density. In such environments, farming began to supplant hunting and gathering. This may have been less a matter of the agriculturalists out-reproducing the hunter-gatherers than of slowly crowding them out as more and more land fell under cultivation. 17 Hence many remaining hunter-gatherers today, like the Khoesān people in southern Africa, have been displaced over time into the least productive land, too marginal to be worth farming.
A 70-fold population increase may seem impressive—and it is—but keep in mind how slowly it happened. Assuming, as we did earlier, 30 years per generation, this amounts to an “effective” fertility rate of only 2.025 children per potential mother surviving into adulthood—barely above two—for a doubling time of about 1,600 years. 18 Traditional farming, in other words, provides enough calories for the population to grow, but just barely. Until very recently, malnutrition and starvation were at least as common among farmers as among hunter-gatherers; it was just that productive land could support many more farmers on a per-area basis, and so, like any other species stumbling upon a new niche, we eventually filled it.
The niche may have been large, but it was also miserable. To get a sense of how grim traditional subsistence farming is, and how recently most of us were still stuck in its Malthusian grip, we need only look at economic data in countries where reliable record keeping goes back a few centuries. For instance, Irish economist Morgan Kelly and economic historian Cormac Ó Gráda have made a detailed study of the positive check under traditional farming in England. In a 2014 paper, they wrote:
[W]hile average living standards in England were high by contemporary standards, a substantial fraction of the population nonetheless lived in deep poverty. Gregory King, in 1688, estimated that one-fifth of England’s population had annual incomes of £2, placing them at the edge of biological survival. 19
Seen this way, farming looks less like a triumphal evolutionary step in which humans achieve mastery over nature, and more like a virus or curse wherein a malevolent suite of specially adapted plant and animal species enslave humanity, cultivating us in concentrated labor camps. The very concept of labor can be understood as a product of this traumatic event. The Book of Genesis seems to echo the trauma in the story of Adam and Eve’s expulsion from the garden of plenty:
I have placed a curse on the ground. All your life you will struggle to scratch a living from it. It will grow thorns and thistles for you, though you will eat of its grains. All your life you will sweat to produce food, until your dying day. 20
In the Hindu tradition, the ancient Ramayana of Valmiki is even more explicit:
In the Golden Age, agriculture was abomination. In the Silver Age, impiety appeared in the form of the agriculture. In the Golden Age, people lived on fruits and roots that were obtained without any labor. For the existence of sin in the form of cultivation, the lifespan of people became shortened. 21
So, agricultural life ground on miserably. With some significant wobbles up and down due mainly to the Black Death, population growth remained in low gear up until about a century before Malthus and Hong Liangji wrote their essays, with the effective fertility rate averaging only 2.06 between 600 CE and 1700 CE.
Let’s pause to take stock of the Black Death, or Bubonic Plague. It was the deadliest pandemic in recorded history, making COVID look insignificant by comparison. The Yersinia pestis bacterium, treatable today with antibiotics, may have killed up to 200 million people in Europe, Asia, and North Africa in epidemic waves from the Middle Ages up to the 17th century (though its deep history appears to go much farther back into antiquity). It was a major positive check, resulting in periods of global population decline even as farming technologies slowly improved.
Tellingly, the unevenness of harvests was a key factor in plague mortality. Hunger interacted with disease in ways that are less obvious to us nowadays than they would have been back then. Per Kelly and Ó Gráda:

[I]t is only with improved public health in the 20th century that people began literally to starve to death: before this most famine victims succumbed to epidemic disease. That epidemics followed poor harvests was not simply because of hunger [… but due to] the interaction between malnutrition and vagrancy. As hungry people took to the roads in search of work or charity, the combination of malnutrition, poor hygiene, exposure to the elements, and psychological stress turned them into both victims and vectors of contagious disease. 22

Black Death notwithstanding, between 600 CE and 1700 CE, the worldwide population doubling time works out to about 700 years. Although this growth rate is formidable when compounded over a few centuries, it still only amounts to a 5% increase over an average 50 year period. So, by fits and starts, in a slow increase unnoticed by contemporary observers, the world population crept up to about 600 million by the year 1700.
To be clear, this is a worldwide average. At certain times and places over those centuries some populations thrived for a time and grew far more quickly. On the other hand, if the Black Death had just decimated the country and one couldn’t zoom out to see the big picture, it would hardly have been obvious on the ground that life was slowly winning out over death. An overpopulation argument like Malthus’s would have seemed like a mathematical abstraction, far removed from reality. The next war, famine, or plague was always just around the corner, and despite endless childbirth, having more than two children survive to have children of their own would have counted as a blessing.
Around the year 1700, though, something remarkable happens. The exponential slope becomes much steeper, with the effective fertility rate jumping to 2.36, for a doubling time of only 124 years. With plague-scale pandemics on pause (due in no small part to better harvests), the increase in population would have been noticeable for the first time over a single human lifespan. Hence the near-simultaneity of the observations by Hong Liangji and Thomas Malthus about a hundred years later—when the new trend had been firmly established—both seems inevitable, and could not have happened earlier. Suddenly, evidence of a population explosion was all around. Multiplying like rabbits, now we were the plague!
Why 1700? The big changes taking place in Europe around then were the Scientific and Industrial Revolutions. 23 They gave rise to a cascade of new technologies that made farming more productive, as well as improving medical care and social systems for resource redistribution and risk pooling. Chinese farming technologies had undergone their own period of rapid development as well, and were starting to reap the benefits of energy-intensive New World crops, especially corn. 24 Many more people could be fed—and they were. In the century leading up to Hong Liangji’s essay, the Chinese population had tripled, from about 100 million to about 300 million. And that was just the beginning.

In 1945, population growth leaps again, stepping into overdrive. This is the baby boom. Boomers are often thought of as an American post-World War II phenomenon; indeed, the war did delay a cohort of pregnancies that otherwise would have been conceived while the men were at the front, thus creating a bulge in the postwar birthrate in the US and many other countries. However, the population curve reveals this demographic turn to be a sustained worldwide transition in effective fertility lasting well over a generation—more of an ongoing roar than a boom.
What happened? As with the Scientific and Industrial Revolutions, developments in public health and agriculture drove the growth.
-Enhanced.webp "Two nurses proudly display 13 newborn babies.")
During the Second World War, antibiotics started to be mass-produced, eliminating a great deal of death from bacterial infection. That had important consequences for injuries on the battlefield, of course, but it also meant that soldiers contracting gonorrhea, chlamydia, or that old Victorian bogeyman, syphilis, could now easily be treated. Rather than vainly trying to impose moral strictures on sex, publicity campaigns began to encourage anyone with symptoms to visit a doctor. For once, ads promising miracle cures delivered.
In civilian life, everyday infections became treatable too. Many of us alive today have caught bugs that would have killed us in an earlier era, either in childhood or in adulthood. Bacteria, from plague-causing Yersinia pestis to E. coli in contaminated food to Staphylococcus from cuts, were an important positive check on human population throughout our entire history—until antibiotics. Indoor plumbing and improved sanitation also prevented disease that would otherwise have killed untold numbers of people, especially in childhood.


Around the same time, farming techniques further revolutionized, not just due to increasingly powerful fuel-powered tractors and farm equipment, but through widespread adoption of oil-derived chemical fertilizers and new generations of hyper-efficient, scientifically engineered crops. The now-boutique practices we file nostalgically under “organic” farming—cultivation of heirloom varieties, avoidance of chemical fertilizers and pesticides—used to be all farming, and it was a lot less efficient. “Better living through chemistry” 25 may sound like a dubious motto to our ears, but synthetic chemicals and genetically modified crops have certainly allowed more of us to live—many more.

The pharmaceutical and agricultural developments of the 20th century have also brought us a bevy of sustainability problems, though. Factory farming depletes the soil, pollutes freshwater, destroys biodiversity, poisons pollinating insects, and relies heavily on nonrenewable, climate-destroying fossil fuels. We’re only beginning to understand subtler, more insidious downsides as well. For instance, routine use of antibiotics has led to widespread antibiotic resistance, while modern hygienic practices may be responsible for weakening our immune systems and devastating our microbial biome. 26

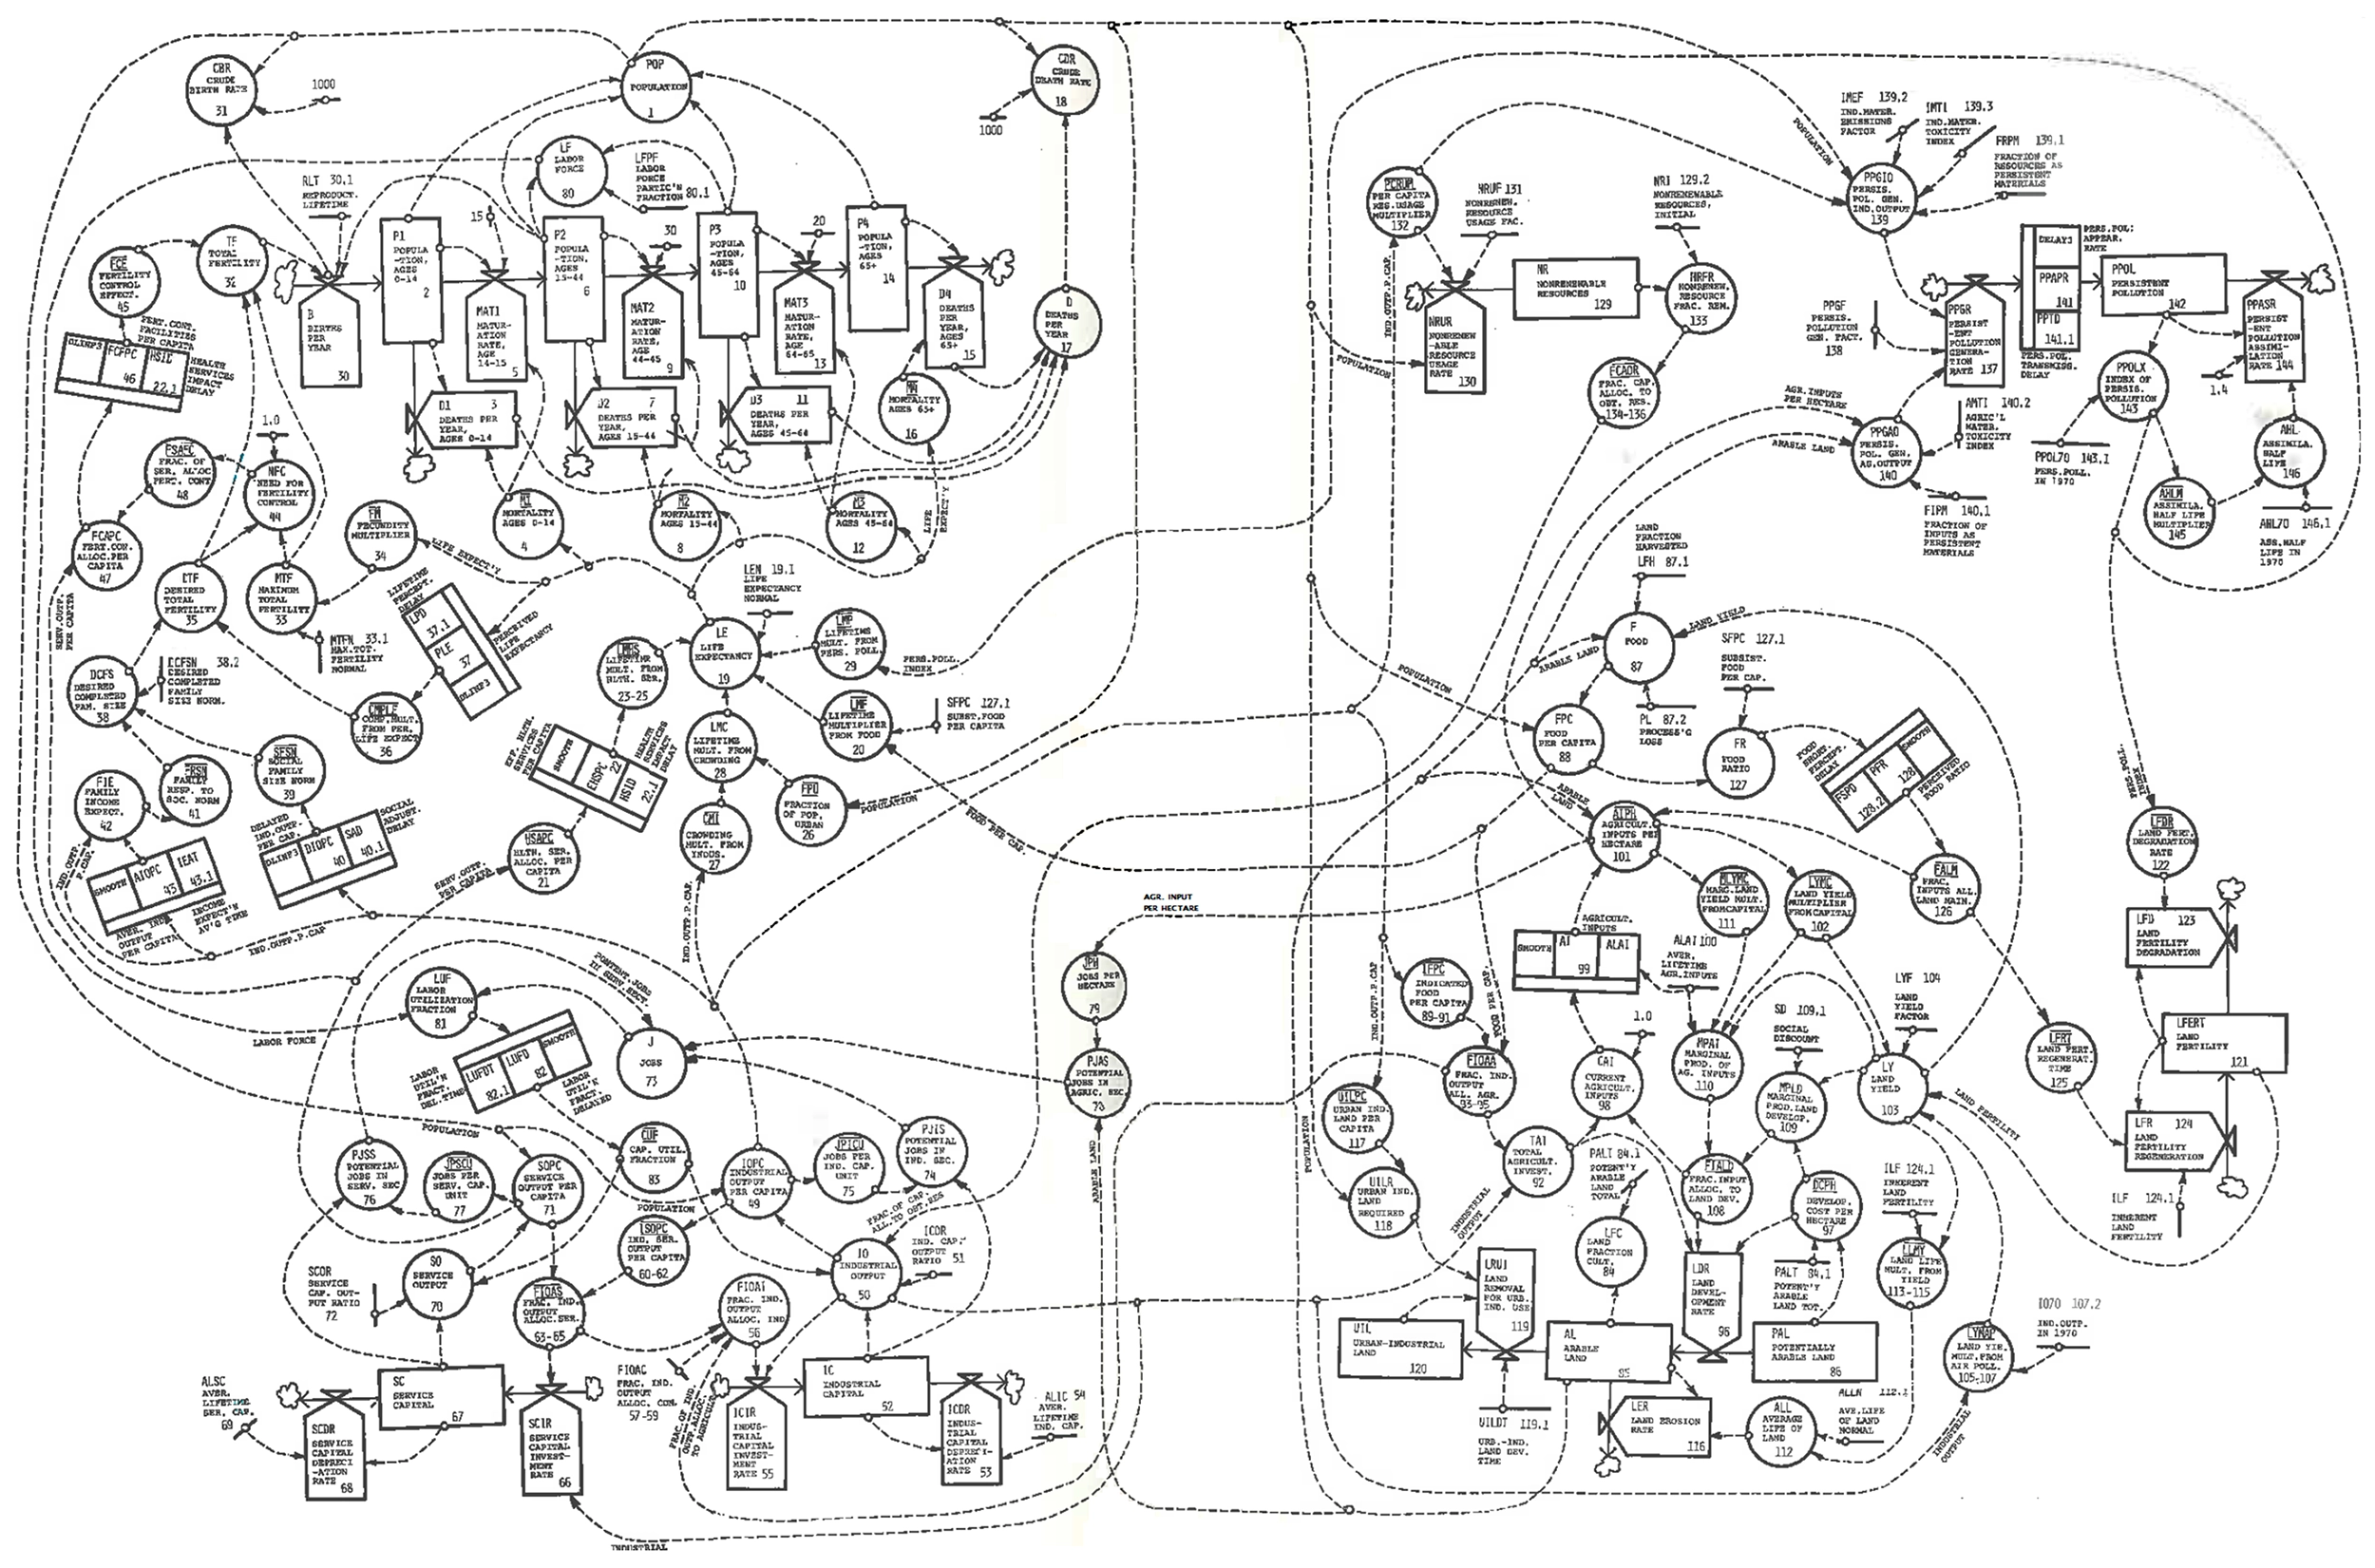
At the root of every other ecological problem of our own making, super-exponential human population growth is in itself unsustainable on a finite planet—obviously. The baby boom led to an urgent revival of this Malthusian anxiety, most famously in a 1972 report, The Limits to Growth (LtG), commissioned by an interdisciplinary group of intellectuals styling themselves the “Club of Rome.” 27 The LtG modeling team, led by pioneering environmental scientist Donella Meadows (1941–2001), used the fancy, newly invented technique of computer simulation to try to quantify Malthus’s intuitions under a range of hypothetical scenarios, taking into account not only population growth and arable land area, but growth in per capita industrial output, pollution, non-renewable resource depletion, and a number of other interrelated variables.


Remarkably—remember, this is 1972—The Limits to Growth specifically calls out global warming as a cause for concern, noting that based on 14 years of carbon dioxide measurements at the observatory on Mauna Loa, CO2 concentrations would reach 380 parts per million by the year 2000, “an increase of nearly 30 percent of the probable value in 1860.” The authors add that a transition to nuclear power could stop CO2 emissions, hopefully “before it has had any measurable ecological or climatological effect.” 30

Unfortunately, that ship has sailed. 31 We first reached 380 parts per million in 2004, and today, we’re seeing arable land area shrink as global warming turns once-fertile equatorial land into desert—which is indeed decreasing the Earth’s carrying capacity, starting in those (often already poor) regions.
As of this writing, in 2022, CO2 levels have shot up to 420 parts per million, a value far higher than it has reached in millions of years, and over a great many glacial cycles. It will continue to rise for at least as long as we remain dependent on fossil fuels, or until our civilization crashes—potentially due to a climate gone haywire. 32 But in the 1970s, public awareness of climate change still lay far in the future.
Stepping on the same rake Al Gore’s climate activism would in the 2000s, The Limits to Growth first became a surprise bestseller, then sparked an immune response from an array of powerful interests, who mounted a largely successful campaign to deny, dispute, and discredit it. 33 The Vatican worried that limits to growth, like condoms, are incompatible with being fruitful and multiplying. 34 The business lobby pushed back because they saw LtG as an unwelcome prelude to regulation. Economists were outraged by the very idea that exponential growth can’t continue forever. The left was also not having it, believing LtG to promote eugenics, or to be an elitist scam to trick the proletariat into believing that a workers’ paradise was unattainable. So, capitalism and Marxism, supposedly sworn enemies, found common ground: growth must continue, and “degrowth” is heresy.
The smear campaign worked. Almost everyone for whom The Limits to Growth still rings a bell today remembers it vaguely as a Chicken Little scare, debunked long ago. And yet, LtG’s model did a surprisingly solid job of tracking the actual numbers over the following decades. 35 Perhaps it resembled Cassandra more than Chicken Little. 36

Luckily for our entire planet, we aren’t seeing yet another upward kink in the exponential growth rate of the human population. Instead, in the most dramatic transition yet, population growth is now screeching to a halt, and soon we’ll see it start to fall—just as The Limits to Growth predicted. This turn away from population growth marks a profound, historic shift for humanity, and we’re right on the cusp of it.
Also luckily, the impending population decline hasn’t been the acute die-off due to resource scarcity that the authors of LtG warned us to expect in their original “business as usual” scenario; we’ve simply been opting to have fewer children. Yay!
But before we breathe a sigh of relief: the LtG model did factor in declining fertility; the decline has just happened quickly enough, and food production has improved quickly enough, to avoid a return of the positive check—so far.
We’re by no means out of the woods, though. None of the LtG scenarios predicted increased mortality before 2020. The authors have always been quick to point out that their model isn’t meant to forecast precise dates or numbers, which is well nigh impossible for a complex nonlinear system like our planet’s ecology/demography/political economy. Rather, they aimed to sketch out, in broad strokes, how the major variables are likely to interact, and what the resulting overall trajectories might look like qualitatively. Still, let’s play along.
| Scenario 37 | Description | Why growth stops |
|---|---|---|
| BAU (Business As Usual) | No assumptions added to historic averages | Collapse due to natural resource depletion |
| BAU2 | Double the natural resources of BAU | Collapse due to pollution (e.g. climate change) |
| CT (Comprehensive Technology) | BAU2 + exceptionally high technological development and adoption | Rising costs eventually lead to declining industrial output and some increased mortality |
| SW (Stabilized World) | CT + changes in societal values and priorities | Population is stable by the mid-21st century, with human welfare remaining high |
The original BAU (“Business As Usual”) scenario was based purely on historical data available in 1972, and assumed “no major change” in “physical, economic, or social relationships.” It predicted a collapse starting around 2020 due to natural resource depletion. Remember all that talk about Peak Oil back in the early 2000s? Everything about modern society depends on oil. Scarcity was the cliff we seemed to be headed over.
Then, fracking technologies saved the day, 38 opening up vast and previously inaccessible oil and gas reserves in shale deposits—starting in the US. So we won’t be running out of gas anytime soon after all. An updated BAU2 scenario, which doubles the natural resource assumptions of BAU, became a better fit.
The bad news: in BAU2, collapse still comes, but due to pollution rather than resource depletion. The research community is in broad agreement on this point: just because we could in principle extract vast reserves of additional shale oil doesn’t mean we can afford to burn it. We have to leave that carbon in the ground. Moreover, if we want to return to anything like our historic levels of atmospheric CO2, we’ll have to use enormous amounts of energy in the future to put the carbon we’ve already released into the atmosphere back into the ground—and, of course, the energy to do so will have to come from some other source.
The CT (“Comprehensive Technology”) scenario is techno-optimistic, assuming BAU2 resources along with rapid development and adoption of new, clean, efficient technologies across the board. CT delays most impacts and greatly softens our landing, avoiding a general collapse in our average living standard. By contrast, BAU and BAU2 both foretell a worldwide return to a 30 year average life expectancy this century, due to mortality rates rising back up to levels we haven’t seen since 1900.
We appear to be somewhere in BAU2 or CT territory, so things could be worse… though they could also have been better, in that we’re gambling our future on further technological rabbits popping out of hats just in time.
The best of all worlds, SW (“Stabilized World”), reaches and sustains a high standard of living for all, but it would have required a much sharper reduction in population growth, targeting a sustained 6 billion people, starting back in 1982. We blew right past that target; it looks like our numbers have well and truly overshot.
The social changes needed to achieve a stabilized population have often been equated with China’s “one child” policy, which was indeed inspired by the Malthusian panic of the 1970s (not least The Limits to Growth) and went into effect in 1980. Birth rates had already been falling in China just as they had been elsewhere, due to economic development. Numerous exceptions to “one child” were also granted beginning in the 1980s. While the policy may not have made any great difference to long term population trends, it did bring human rights abuses, including forced contraception, abortion, and sterilization. It also contributed substantially to the vast number of “missing women” worldwide due to sex-selective abortion or infanticide, as under patriarchy it was deemed preferable for the “one child” to be a boy (see Chapter 12).
After many years of international criticism and internal debate, the “one child” policy was finally eased to allow for two children in 2015. All limits were removed in 2021. Today, China’s fertility rate is nonetheless well below two, and still falling—a trajectory broadly similar to those of other countries making the transition out of poverty. The moral: we could have achieved a Stabilized World decades ago, not by instituting China’s draconian “one child” policy globally, but by greatly accelerating the economic development of the world’s poorer countries, as the next chapter will explore.
Further technological jackpots that avoid the pollution-induced crash of BAU2 are still possible, of course. As I’m making final revisions to this chapter, news is breaking that at Lawrence Livermore National Laboratory, scientists have used lasers to finally achieve nuclear fusion that releases more energy than it consumes. This is a major milestone. Cheap, large-scale fusion power would change everything, allowing us to stop burning fossil fuels and even power a massive carbon recapture effort. However, the news is full of disclaimers and caveats. Real fusion power plants still seem to be many decades away. 39 We know of no magic bullets that can get us out of our pickle quickly or painlessly.
The scenarios that haven’t already been ruled out suggest that a hard time for humanity, our overshoot “correction,” may lie just ahead. On the other hand, technology is still advancing, continuing to offer cleaner and more efficient ways for us to thrive. It’s a high-stakes race between overshoot and innovation. Perhaps as soon as the late 2020s or 2030s, we’ll have a clearer picture of which kind of scenario—hard landing or soft—we’ll need to contend with. In this book’s final chapters, we’ll explore some of the social and technological developments that are likely to determine the outcome.
Despite the LtG authors’ injunction not to take their modeled dates too seriously, it’s interesting to see that after so many decades of declining mortality, we’ve witnessed worldwide death rates rising again from 2020 through 2022—right on schedule. But, you’ll object, that’s COVID-19! Pandemics just happen; their timing has nothing to do with limits to growth! 40
It’s true that a pandemic can strike at any time. Before dismissing COVID as random bad luck irrelevant to the big picture, though, consider that, as with the Black Death, COVID mortality isn’t random; it’s strongly correlated with underlying health factors, both at the individual and at the community level. That’s why people in poor counties in the US died of COVID at nearly twice the rate as those in rich counties, 41 and during the especially deadly Delta wave, at five times the rate.
Just as in the Middle Ages, we would not expect the direct causes of death during a widespread resurgence in mortality to be starvation, but rather, war, epidemic disease, and the general poor health that tends to accompany poverty. Moreover, even before COVID, the decline in mortality in the developed world had already been slowing, and even, as noted in the previous chapter, starting to increase again in the American countryside—a function not only of poverty in the traditional sense, but of disconnection and eroding social capital. Rising economic inequality is doubtless a factor as well, since it prevents available resources from reaching those who most need them, even as aggregate wealth rises.
At any rate, we’ll soon find out whether COVID-19 is a blip or the start of a larger reversal in the long-running decline in mortality. I hope it’s just a blip.
Like Lynn Margulis, that other pioneering theorist of planetary-scale thinking, Donella Meadows stirred up great controversy yet somehow still labored in relative obscurity throughout most of her career. She died young, in 2001. Dennis Meadows, Donella’s partner and LtG co-author, carried on with the work. In 2022, he was interviewed for the 50th anniversary of the original report. In response to the usual “So what’s ahead?” wrap-up question, he said,
I’m an old activist. I’m 80 years old. […] I don’t know what’s coming. I look at those downward sloping curves […] and I honestly don’t know what it’s going to look like on the ground over the next 40 to 50 years. But my guess is that some people may come through this period not even being much aware of collapse, whereas others, of course, are already far into the decline of their personal situation, their culture, their community, and so forth. 42

The plot actually shows postmenopausal people assigned female at birth, to ensure all childbirths are captured.
Craig, “Replacement Level Fertility and Future Population Growth,” 1994.
Today, the odds of an American woman dying under the age of 44 are only about 3%, so intersexuality (which often implies diminished fertility or sterility) is at least as likely, and will thus be as large a contributor to raising replacement TFR above two. Office of the Chief Actuary, Social Security Administration, “Period Life Table, 2019, as Used in the 2022 Trustees Report,” 2022.
United Nations, Department of Economic and Social Affairs, Population Division, “World Population Prospects 2022, Online Edition,” 2022.
Ehrlich and Ehrlich, The Population Bomb, 1968.
People do of course live longer than a single “generation,” so at least initially, the drop wouldn’t be quite so quick.
In modern language, we would say that population grows exponentially, while the food supply only increases linearly. Malthus’s arguments for linear growth in the food supply are less than airtight, but his conclusion would follow more directly simply by noting that the Earth’s food production capacity is finite. An exponential will exceed any finite threshold, and more quickly than you’d think.
Malthus, An Essay on the Principle of Population, 1798.
Ho, Studies on the Population of China, 1368-1953, 271–72, 1959.
Malthus, An Essay on the Principle of Population, 1798.
McCormick, “Infant Mortality and Child-Naming: A Genealogical Exploration of American Trends,” 2010.
K. F. Foundation, “Infant Mortality Rate by Race/Ethnicity (2019),” 2022.
Hu, “A Micro-Demographic Analysis of Human Fertility from Chinese Genealogies, 1368-1911,” 2020.
Or organize, depending on your politics.
Sahlins, “The Original Affluent Society,” 1972; Berbesque et al., “Hunter-Gatherers Have Less Famine than Agriculturalists,” 2014.
Hill, Hurtado, and Walker, “High Adult Mortality Among Hiwi Hunter-Gatherers: Implications for Human Evolution,” 2007.
Bettinger, “Prehistoric Hunter-Gatherer Population Growth Rates Rival Those of Agriculturalists,” 2016.
Historical generation times would likely have been shorter, which given a known doubling time, would drive our estimate of each generation’s fertility lower still.
Kelly and Ó Gráda, “Living Standards and Mortality Since the Middle Ages,” 2014.
Gen. 3:17–19 (New Living Translation).
Mehta, “Did Agriculture Reduce Human Lifespan?,” 2001.
Kelly and Ó Gráda, “Living Standards and Mortality Since the Middle Ages,” 2014.
It has been argued (e.g. by Steven Shapin, in his influential book The Scientific Revolution, 1996.) that these weren’t properly “revolutions,” but gradual accumulations of evolutionary changes upon which we only impose a “revolutionary” narrative in later historical accounts. There’s some truth to this. On the other hand, the sharp turn in the population curve suggests that the term “revolution” isn’t mere hyperbole for what happened around 1700.
Although the Chinese and European cultures may have seemed worlds apart, remember that they shared a single continent, and were webbed together by the silk routes, where both goods and ideas flowed continually back and forth. The importance of New World crops in China also speaks to the way the technological and agricultural histories of Europe and China were closely coupled.
A slogan chemical giant DuPont adopted in 1935, then quietly dropped in 1982.
Blaser and Falkow, “What Are the Consequences of the Disappearing Human Microbiota?,” 2009; Rook, “Hygiene and Other Early Childhood Influences on the Subsequent Function of the Immune System,” 2011; Vandegrift et al., “Cleanliness in Context: Reconciling Hygiene with a Modern Microbial Perspective,” 2017.
Meadows et al., The Limits to Growth: A Report for the Club of Rome’s Project on the Predicament of Mankind, 1972.
The most cogent critiques were leveled at the report’s predictions of imminent resource depletion based on known reserves (e.g. of chromium); subsequent resource exploration based on the market demand increased reserve estimates a good deal, making predictions that we’d run out of chromium look alarmist. This isn’t a compelling argument for dismissing the report or the model, though, given that its whole point was to allow researchers to explore the implications of different assumptions about reserves and technology improvements.
These time lags can be thought of as a kind of inertia or momentum in many key variables, such as pollution and population.
Meadows et al., 73.
Also unfortunately, nuclear power has become unpopular due to high-profile accidents (Three Mile Island, Chernobyl, and Fukushima) and an association with Cold War nuclear anxieties, despite being an excellent complement to solar energy. The environmental impacts, health risks, and fatalities associated with nuclear power are all orders of magnitude lower than those of the fossil fuel plants needed to meet demand following the widespread closures of nuclear reactors. Shellenberger, “Testimony Before the United States Senate Committee on Energy and Natural Resources,” 2021.
Tans and Keeling, “Carbon Cycle Greenhouse Gases, Trends in CO2,” 2022.
Bardi, “Cassandra’s Curse: How ‘The Limits to Growth’ Was Demonized,” 2008.
Piccioni, “Forty Years Later. The Reception of the Limits to Growth in Italy, 1971-1974,” 2012.
Turner, “A Comparison of The Limits to Growth with 30 Years of Reality,” 2008; Hall and Day, “Revisiting the Limits to Growth After Peak Oil,” 2009; Pasqualino et al., “Understanding Global Systems Today—A Calibration of the World3-03 Model Between 1995 and 2012,” 2015; Herrington, “Update to Limits to Growth: Comparing the World3 Model with Empirical Data,” 2021.
In Greek mythology, Cassandra was a Trojan priestess fated to utter true prophecies nobody would believe. Chicken Little refers to an old European morality tale about a foolish chicken whose false cries of “The sky is falling!” lead to unwarranted panic.
Adapted from Herrington, “Update to Limits to Growth: Comparing the World3 Model with Empirical Data,” 2021 and Meadows, Randers, and Meadows, The Limits to Growth: The 30-Year Update, 2004, though Herrington uses the LtG authors’ scenario 9 for SW, while I use scenario 10.
DeCarolis and LaRose, “Annual Energy Outlook 2023 with Projections to 2050,” 2023.
Chang, “Scientists Achieve Nuclear Fusion Breakthrough With Blast of 192 Lasers,” 2022.
The only other comparable dip marring the upward trend in worldwide life expectancy over the last two centuries occurred between 1958–1961, due to the 15–55 million people estimated to have died during China’s Great Leap Forward. The World Health Organization estimates that COVID-19 has been responsible for 14.9 million excess deaths in 2020–21. WHO Technical Advisory Group for COVID-19 Mortality Assessment, “14.9 Million Excess Deaths Associated with the COVID-19 Pandemic in 2020 and 2021,” 2022.
Timmons, “U.S. Poor Died at Much Higher Rate from COVID than Rich, Report Says,” 2022; “A Poor People’s Pandemic Report: Mapping the Intersections of Poverty, Race and COVID-19,” 2022.
Heinberg and Meadows, “Dennis Meadows on the 50th Anniversary of the Publication of The Limits to Growth,” 2022.