


Differences in culture and outlook between the city and the countryside manifest themselves in political struggle. Broadly speaking, politics are about the push and pull of interests, ideologies, and identities. In a democratic country with established institutions and the rule of law, those laws and institutions form a status quo, and in response to the populace’s push and pull, the status quo evolves over time.
Think of the “first principal component” of politics in terms of that trajectory—specifically, as gas pedal and brakes. Progressive people want to step on the gas, pushing forward with change, while conservative people want to step on the brakes, slowing the rate of change.
Obviously, politics are a lot more complicated than this one-dimensional gas versus brakes cartoon. The variety of answers to the optional, vaguely worded “essay question” on the political surveys I ran in 2016 and 2020 reveal the complexity (and occasional zaniness) of people’s ideological convictions:
i want to dissolve the two party system, legalize all drugs and end the drug war, then use that money to provide rehab and drug awareness. Stop bombing overseas and start rebuilding, help local groups fight back against terrorism and tyranny by funding and equipping them rather than direct intervention. i think we should all have guns, free healthcare, and welfare for the poor but take government out of it as much as possible. 1
I am a conservative liberal. People have the right to do and be who they are as long as it does not physically harm another person who has been born. 2
I’m a monarchist. We’re misunderstood by liberal whites. 3
Independent thought seems to be alive and well!

Still, the “progressive versus conservative” dimension does appear to capture the lion’s share of variation in people’s political positions, both in the US and in many other countries; hence the universal distinction between “left wing” (progressive) and “right wing” (conservative). The Baron de Gauville, a deputy at the National Assembly during the French Revolution, explained how the association with left and right came to be: “Those who were loyal to religion and the king took up positions to the right of the chair so as to avoid the shouts, oaths, and indecencies that enjoyed free rein in the opposing camp.” We can hear echoes of the same old themes in the name of the progressive grassroots organization MoveOn.org—gas pedal!—and on the right, the rallying cry—
make america great again! 4
—which goes beyond brakes, and calls for reverse.
The simple “gas versus brakes” model of politics, combined with the idea that population density drives cultural evolution, yields a prediction: local population density will play a bigger role than any other single factor in determining a person’s politics—and, more broadly, identity. Put another way, “who we are” is in no small part a function of where we are. This was one of the main hypotheses I set out to test when I first began running Mechanical Turk surveys in 2016. The surveys included not only questions about voting, but also about current social issues, including:
Do you believe that global warming is an imminent threat?
Are you in favor of a woman’s right to an abortion?
Do you consider yourself a supporter or ally of LGBT rights?
Are you a supporter of same sex marriage rights?
Are you a supporter of the Black Lives Matter movement?
Are you in favor of federally funded universal healthcare?
Is the imposition of Sharia law within the US a threat?
Should the US be more aggressive in deporting illegal immigrants?
Are white Americans being systematically undermined or discriminated against?
Do you believe that enacting gun control measures is a bad idea?
Do you consider homosexuality morally wrong?
Should the US put a halt to the immigration of Muslims?
Indeed, both in 2016 and in 2020, the answers to these dozen questions follow one of two patterns as a function of population density. The first six generate an overwhelming “yes” (typically 90–100%) from people in the densest ZIP codes, but drop down dramatically in the countryside.
Climate change, marriage equality, and abortion rights are broadly popular causes; support for these only drops below half in the most sparsely populated places, and even there, not by much. LGBT rights, Black Lives Matter, and universal healthcare are more divisive, with support in the countryside dropping to 20–30%—though even for these issues, support in the great majority of ZIP codes, covering not only the cities and suburbs but even much of the countryside, remains a robust 60–70%. Again, big dropoffs occur only in the most sparsely populated places.
The remaining six questions follow the opposite pattern: only 10% or so of people in the densest urban ZIP codes say “yes,” but upward of 50% of those in the deep countryside do, with concern about gun control, Sharia law, and deporting illegal immigrants reaching as high as 80–90%.
Consider the question, “Is the imposition of Sharia law within the US a threat?” Sharia (شريعة) meaning “Islamic law,” is a religious law forming part of the Islamic tradition. 5 According to the US Constitution, no religious tradition can be used as the basis for any law, though Christian beliefs and values have clearly shaped popular opinion, hence law, on a variety of issues—such as abortion. Muslim Americans are a small minority, though, making the idea that Muslim religious traditions could gain enough political traction to shape US law anytime soon far-fetched.
This question’s relationship with the presence of Muslims in the neighborhood is especially interesting. Considerably fewer Muslims live in the US than Jewish people. In the densest ZIP codes, the Jewish population exceeds 13%—though the imposition of Jewish religious law, Halakha (הֲלָכָה) seems less of a popular concern. 6 Muslim Americans, too, tend to live near cities, though their numbers are greatest just outside the urban core. At no density does their concentration exceed 4% or so. In the deep countryside, they disappear entirely from the population. Yet it’s in these very places, where there are no Muslims for miles around, that people are most concerned about Muslim immigration and Sharia law.
Similarly, graphing answers to the questions “Were you born in the US?” and “Do you identify as White / European American?” reveals a powerful sorting effect. Fewer than half of those living in inner cities identify as white, and fewer than 60% were born in the US. In the most rural ZIP codes, though, virtually everyone is white and native-born. Yet 60% of this same rural population answers “yes” to “Are white Americans being systematically undermined or discriminated against?” That number is close to 0% in the city. Why?
Perhaps because, in a bustling city full of immigrants, people of different races, ethnicities, and religions live cheek by jowl and are familiar with each other. Neighbors walk by one another on the street, mix socially, and eat together; they might become friends, go on dates, become partners, end up raising families. Whatever your background, other races and ethnicities aren’t a mystery in the city, and given firsthand exposure to non-white people, most white people find it hard to cling to a conviction that they are singled out or structurally disadvantaged, or that immigrants in the neighborhood pose an existential threat to their way of life.

On the other hand, many rural Americans do feel that their way of life is under threat—and with good reason. Their communities have been economically hollowed out, unemployment and poverty are endemic, infrastructure is crumbling, public transit and education are inadequate, and on top of that, opioid drugs are ravaging the social fabric. Improvements in healthcare have led to steadily declining mortality in the city, but the countryside has been left behind; among rural Americans aged 25–64, mortality hasn’t just failed to decrease, but has increased from 1999 to 2019. 7 It was rising even before COVID hit, but naturally, the pandemic made the situation even worse.
While questionable policy decisions, the misdeeds of OxyContin® manufacturer Purdue Pharma, and plain bad luck have all played their part, it’s hard not to see the confluence of crises in the rural US as connected to an underlying cause: the demographic emptying-out of end stage urbanization. It’s unsurprising that conditions in rural areas and small towns can generate resentment, or, given a largely homogeneous racial makeup, that the resentment can become racially (or ethnically, or religiously) charged. The easiest “other” to resent is someone who isn’t present, someone you can imagine enjoying a better life elsewhere. And indeed, by many measures, life in the big city—where all those “other” people live—is better.
Why is the countryside so overwhelmingly white? There are a few reasons. First, European colonists systematically dispossessed native populations, moving them off lands they declared “public” and selling the parcels to white agriculturalists. 8 Then came Jim Crow era racist land policies, and associated waves of so-called “white flight” to the suburbs throughout the 20th century. One of the more infamous practices, often referred to as “redlining,” involves federal and local governments drawing racial boundaries on maps, and either denying services to people within certain areas or using selective pricing to enforce de facto segregation. For instance, in the 1980s, Pulitzer Prize winning investigative reporter Bill Dedman showed how, in Atlanta, banks often financed mortgages for lower-income whites, but not for middle- or even upper-income Black people, in effect excluding them from certain neighborhoods while creating urban ghettos. 9

When immigrants come to the US, they also typically arrive in—and remain in—the cities. Not only are cities where the educational and economic opportunities tend to be; they’re also, as we’ve seen, the places to go for minorities of all kinds to find community. That probably explains why, at the rural extreme of the density scale, there isn’t a single survey respondent who was born outside the US!
From the above it’s clear why inner cities and suburbs tend to be ethnically mixed, and why people in the countryside tend to be native-born. Most Black Americans aren’t recent immigrants, though. Why, then, do so few of them live in rural places?
Redlining is usually understood as a city and suburb phenomenon, but equally unfair practices have victimized Black farmers. The Counter, a “nonprofit, independent, nonpartisan newsroom investigating the forces shaping how and what America eats,” published an investigative piece in 2019 detailing a century-long history of systematic discrimination against Black farmers by the US Department of Agriculture (USDA):
USDA and federal farm policy are largely responsible for driving black people out of farming almost entirely. Black farmers lost around 90 percent of the land they owned between 1910 and 1997, while white farmers lost only about 2 percent over the same period. 10

Structural inequalities aren’t limited to discrimination against Black people. In the US, 86% of farm owner-operators are male, and only 6% are Hispanic. Meanwhile, 80% of farm laborers are Hispanic. While a number of factors might contribute to this discrepancy, one stands out: exclusionary policies have targeted them too. Asian landowners have also been systematically disenfranchised, and, of course, Native Americans. 11
The countryside’s homogeneity—and the near absence of any immigrant influx, other than seasonal labor—has had another effect as well: the rural population today is considerably older than the urban population. As societies industrialize, their birth rates plummet, a topic I’ll take up in more detail in the next chapter. In countries with advanced economies but very low immigration rates, like Japan, low birth rates have led to a population strongly skewed toward older people. The same has happened in the American countryside, as revealed by Census Bureau statistics. 12
Around age 18, many young adults who grew up in the countryside move to the city, whether to go to college, find work, or find their community. Relative to the national average, this results in an urban overrepresentation of young adults and a corresponding rural underrepresentation of young adults. It also leads to an overrepresentation of older adults in the countryside, since these curves are distributions, meaning that they add up to 100%: like lumps on a carpet, pushing down on one spot moves the lump elsewhere.
Remember that, in every breakdown by age, being older proved to be a powerful predictor of conservatism. So is living in the countryside, even when age is held constant. So, the higher proportion of older people in the countryside creates a compounding effect. Rural places end up older, whiter, more conservative, and more heteronormative. People living in rural areas aren’t exposed to much diversity, and that makes them even more afraid of the invisible “other.” It also makes them feel outnumbered, threatening their long-held belief that they are the majoritarian norm. Indeed, they’re right to believe that they no longer are.
If you are living in a rural place and you’re “other”—whether that means Black, queer, non-monogamous, or for that matter just not so conservative—it also means you’re likelier to move to the city if you can, because you probably won’t find community in the countryside. Consequently we’ve found ourselves in a feedback loop, with the rural places becoming ever more conservative, even as the cities become more progressive.
Although these are long-term trends, evidence of them can be seen by comparing responses to the survey in 2016 and in 2020, when I re-ran it with many of the same questions. For example, graphing support for the Black Lives Matter (BLM) movement as a function of density illustrates the way social change originating in cities tends to be slow in percolating into rural places.
Support for BLM was always higher in the city than in the countryside, but in 2016 the differences were a bit less stark—around 80% in the city, and about 15% in the deep countryside, a 65% gap. By 2020, BLM had gained huge support overall, rising 20% nearly everywhere to reach virtually 100% in the densest neighborhoods. However, at the lowest densities, support remained unchanged; the rural-urban gap had grown to an extraordinary 85%. The increased polarization wasn’t a case of people in the countryside becoming more conservative; they just stayed put—as best we can tell given those large error bars (due to small numbers) in the most rural places.
A similar pattern in mirror image holds for responses to the question “Are white Americans being systematically discriminated against?” This conservative talking point was a minority view in the city and suburbs in 2016, and became even more so by 2020. However, it’s a majority perspective in the deep countryside, where opinion remained unmoved over those four years.
It would be wrong to conclude that the countryside doesn’t change over time, though (a point I’ll unpack further in Chapter 20). Over these four years, so many more people have become aware of racially biased policing that “staying put” on questions of race arguably looks more like swimming against the tide. The surveys show evidence of actively rising rural conservatism in the answers about climate change, deporting illegal immigrants, and banning Muslim immigration.
As the cities and suburbs liberalize, the countryside is not only digging in its heels, but becoming increasingly conservative, xenophobic, and aggrieved.
I’m a proud white nationalist. 13
I am a white male and thus hated in my own country. 14
The xenophobia goes beyond race, also targeting other minorities, as is evident in the changing response to “Do you consider homosexuality morally wrong?” While these curves look similar in the city and suburbs from 2016 to 2020, rising steadily from zero to around 30%, moral disapproval of homosexuality in the most rural places has tripled over these four years, rising from around 20% to likely above 60%. 15 It’s easy to see why, if you’re queer and grow up in the countryside, you’ll probably want to move to the city as soon as you can, especially nowadays—which will, in turn, amplify the political urban/rural sorting effect.
Recall, from the Census Bureau’s urban/rural age distribution, how the rural population takes an immediate dive and the urban population rises by about the same percentage right at age 18, when kids become legal adults in the US. That’s also the age at which many young people go to college, and most colleges and universities aren’t rural. 16 It’s a safe bet, though, that the incentive to move to the city, whether to go to college or to take your chances on the job market there, will be a lot higher if you don’t fit in where you grew up. And if you do find your community in the city, it’s unlikely that you’ll be eager to return to the countryside later in life.
The increasingly pro-gun stance of rural Americans disquiets many progressives. This trend likely goes along with higher rates of armament, not just with handguns or hunting rifles but with arsenals of long guns and machine guns associated with tactical assault or warfare. 17 Whether such weapons can be considered reasonable investments in “self-defense” depends on whether one is talking about defending a home against an intruder or a village against an invading army. In cities, where most deaths from gun violence occur, well under 10% of the population feels that it would be a bad idea to enact stronger gun control measures. Yet the sense of needing armed protection from “those other people” is highest in the most rural places. In 2016, fewer than half felt that stricter gun control was a bad idea, but by 2020, that figure had risen above 80%.
At the end of Part II, noting the way so many of us spend most of our time online nowadays, I posed the half-serious question, “Does this mean we’ve already been uploaded?” Put another way, does where we live matter anymore, or are we all living virtually, in a kind of simulated social life where the constraints of physical space have been nullified? The findings in this chapter suggest that, despite living online, where we make our home physically still matters—a lot. Otherwise, there wouldn’t be such dramatic variations in attitudes and values by ZIP code.
At least in part, the geographic “sorting hat” effect, in which certain subpopulations end up better represented in the countryside and others in the city, accounts for such variations. However, this is unlikely to be the whole story. We’ve seen the power of social transmission in determining our perspectives, attitudes, and identities: Our friends influence us. Our friends also tend to be nearby, even in this era of ubiquitous online communication. In his 2021 book Friends, British anthropologist Robin Dunbar summarizes a wealth of evidence showing the correlation between friendship and physical proximity:
There is an unwritten law in the study of social networks known as the ‘Thirty-Minute Rule’: you will make the effort to see someone, and view them as important to you, if they live within thirty minutes’ travel time of where you live. […] That being so, you might suppose that you would be more inclined to phone or text those who live beyond the thirty-minute limit to make up for the fact that you can’t get round to see them in person. In fact, it seems that you don’t. You are more likely to phone the friends that live near you, as Hang-Hyun Jo was able to show from an analysis of phone-call patterns 18 […]. [Y]ou phone most often the people you see most often. […] When people move away and don’t have the opportunity to meet up so often, friendships seem to flag surprisingly quickly […] [A] friendship of high strength will decline to no more than a mere acquaintanceship in just three years. 19
So social proximity explains why geography continues to matter when it comes to our beliefs and identities. We may spend many hours each day online, interacting with friends and scrolling through social media; but who those friends are, hence which social media, will depend in no small part on where we live.
The stark and rising polarization in worldview created by these social sorting effects paints an alarming picture for observers on either side of the political divide. Many feel under threat, and may even seek to cut any remaining ties with the “other” camp. For instance:
I think European Americans need to hold a referendum to cut our losses. We can separate into two groups, those who are loyal to the Caucasian race and those who are not, aka white race traitors. Those who are disloyal can get out. They can take their Jewish conspirators with them for the 1965 Immigration Reform Act and the Federal Reserve. First order of business; civil war to establish a new “whites only” nation. Second on the list; nuke Israel for 9/11. The researchers might think European Americans and members of the Caucasian race are unaware we are experiencing genocide. We are. And white leadership, across the board, is directly responsible for it. My guess, think the French Revolution on acid is what is coming our way. 20
It has become commonplace to characterize the growing divide as a possible prelude to civil war. Today’s situation is very different from the one preceding the US Civil War, though; that war was fought between a bloc of northern emancipated states and a bloc of southern slave states. That’s not how it breaks down now. It’s hard to imagine a civil war between the cities and the countryside—because they are so mutually dependent, and the “borders” don’t look like country borders at all.
An early “culture wars” meme from the 2004 presidential election depicted a satirical “Jesusland map,” with Jesusland consisting of the states in the heartland and south, and a “United States of Canada” combining the more liberal coasts with their low-key, progressive neighbor to the north. This state-by-state political picture is inaccurate, though. The real “Jesusland map” looks more like NASA’s Black Marble—and that just doesn’t look like a map of two countries in any conventional sense. It looks like an increasingly interconnected network of “United Cities” pitted against a vast, sparsely populated, and increasingly conservative hinterland. This explains the analogous polarization happening in many other countries too, even those that have nothing comparable to the American Civil War in their histories.
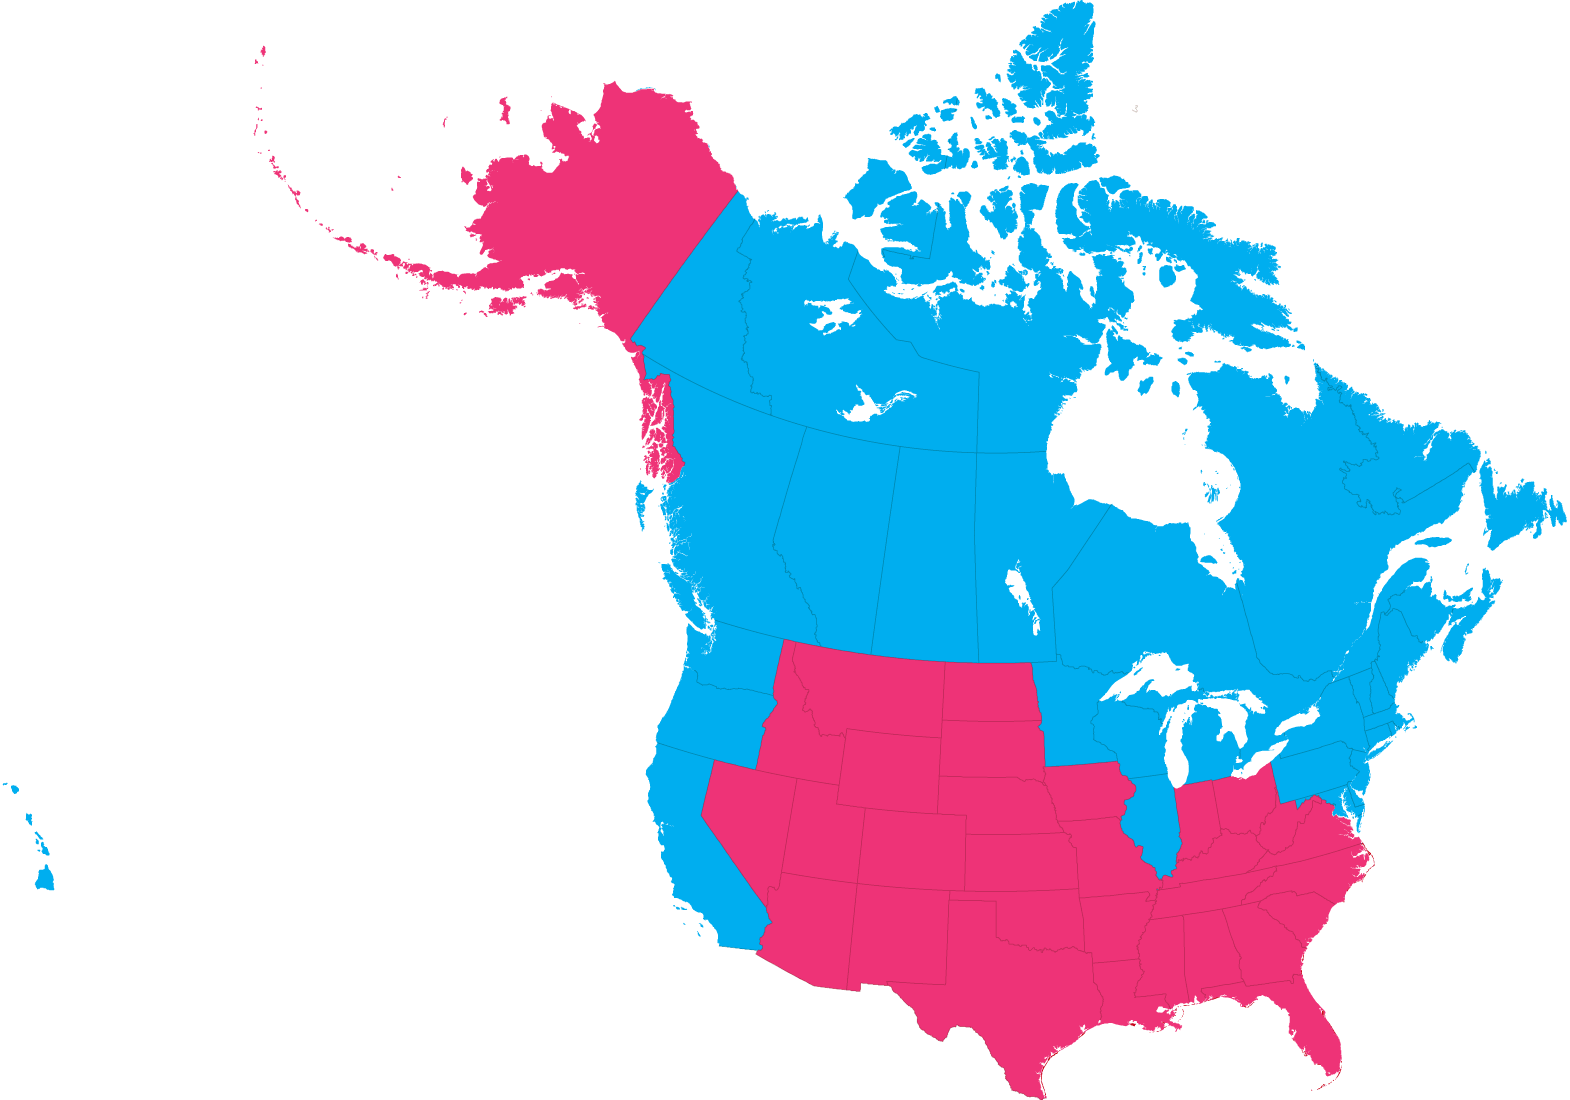
Jesusland
United States
of Canada
An entrenched two-party system, which has in recent years shifted to align itself almost perfectly with the rural-urban axis, has exacerbated the political divide in the US. In 2016, ZIP code density already did a better job of predicting voting for Trump or Clinton at the urban or rural end of the spectrum than any other obvious variable (e.g. race, gender, education, wealth). Zero survey respondents in the densest ZIP codes answered “yes” to “Did you vote for Donald Trump in the November 2016 presidential election?” while about 95% answered “yes” to “Did you vote for Hillary Clinton in the November 2016 presidential election?” In the sparsest ZIP codes, three quarters of the respondents had voted for Trump, while the Clinton vote dropped to zero. This degree of political sorting by population density is astonishing.
In June 2020, the conservative voting pattern remained virtually unchanged, especially among conservative voters in the sparsest ZIP codes. On the other hand, the progressive vote in urban and suburban ZIP codes—where a larger (and, in the end, decisive) fraction of people said they would vote for Joe Biden—shifted much more. Many of these people had voted for a third-party candidate in 2016, so in this sense, the punditry’s view that Biden was less divisive than Clinton was correct. However as a consequence, if anything, the overall polarization between city and countryside increased between 2016 and 2020 as the left finally coalesced.
For better or worse, democracy, and especially its American two-party variant, is inherently biased toward inertia. Put another way, there is a conservative bias. The arrow of time itself works against progressivism. Many possible paths take us forward, while the past (even if we mythologize it) is easier to pin down, hence easier to form a coalition around. Relatedly, conservatives tend to evolve more slowly in their positions—or they wouldn’t be called “conservative.” They’re also a more homogeneous population, which makes them more coherent in their cultural values and positions; conservatives can effectively align and push for a stable agenda over many years, while diverse, faster-evolving progressives with divergent visions of the future spend more time infighting. Conservatives are “dog people,” loyal and able to hunt effectively in packs (or PACs!), while progressives are more like “cat people,” individualistic and impossible to herd.
This observation bears more weight than a snappy cliché. Psychological research has shed light on systematic differences between the way liberals and conservatives evaluate moral choices. As Jonathan Haidt and colleagues wrote in a highly influential 2009 paper,
We […] do not think of political ideology—or morality—as a strictly one-dimensional spectrum. In fact, we consider it a strength of [our] theory that it allows people and ideologies to be characterized along five dimensions. Nonetheless, we expect that the individualizing–binding distinction can account for substantial variation in the moral concerns of the political left and right, especially in the United States, and that it illuminates disagreements underlying many “culture war” issues. 21
The five dimensions of the researchers’ “Moral Foundations Theory” are harm/care, fairness/reciprocity, ingroup/loyalty, authority/respect, and purity/sanctity. The first two are “individualizing” or, as I’ve put it, cat-like. The last three are “binding,” or dog-like. Liberals rely far more on the individualizing values in making their judgments, while conservatives rely on all five. More recent work from the University of Birmingham in the UK supports the connection between moral foundations and politics:
Individualizing-Ingroup Preference and Binding-Ingroup Preference scores predicted more Attitude Bias and more Negative Attitude Bias toward immigrants […], more Implicit Bias […], and more Perceived Threat from immigrants […]. We also demonstrated that increasing liberalism was associated with less Attitude Bias and less Negative Bias toward immigrants […], less Implicit Bias […], and less Perceived Threat from immigrants […]. 22
Beyond the inherent challenges to progressive change, considering this chapter’s graphs alongside the population density curves from the previous chapter brings to light something odd and perhaps undemocratic. About 90% of the US population lives below 30,000 square meters per person (about halfway between 10,000 and 100,000 on the logarithmic axis), which is roughly where the voting curves cross over each other. And indeed, the Democrats garnered more votes than the Republicans in both the 2020 and the 2016 elections. But all votes aren’t equal.
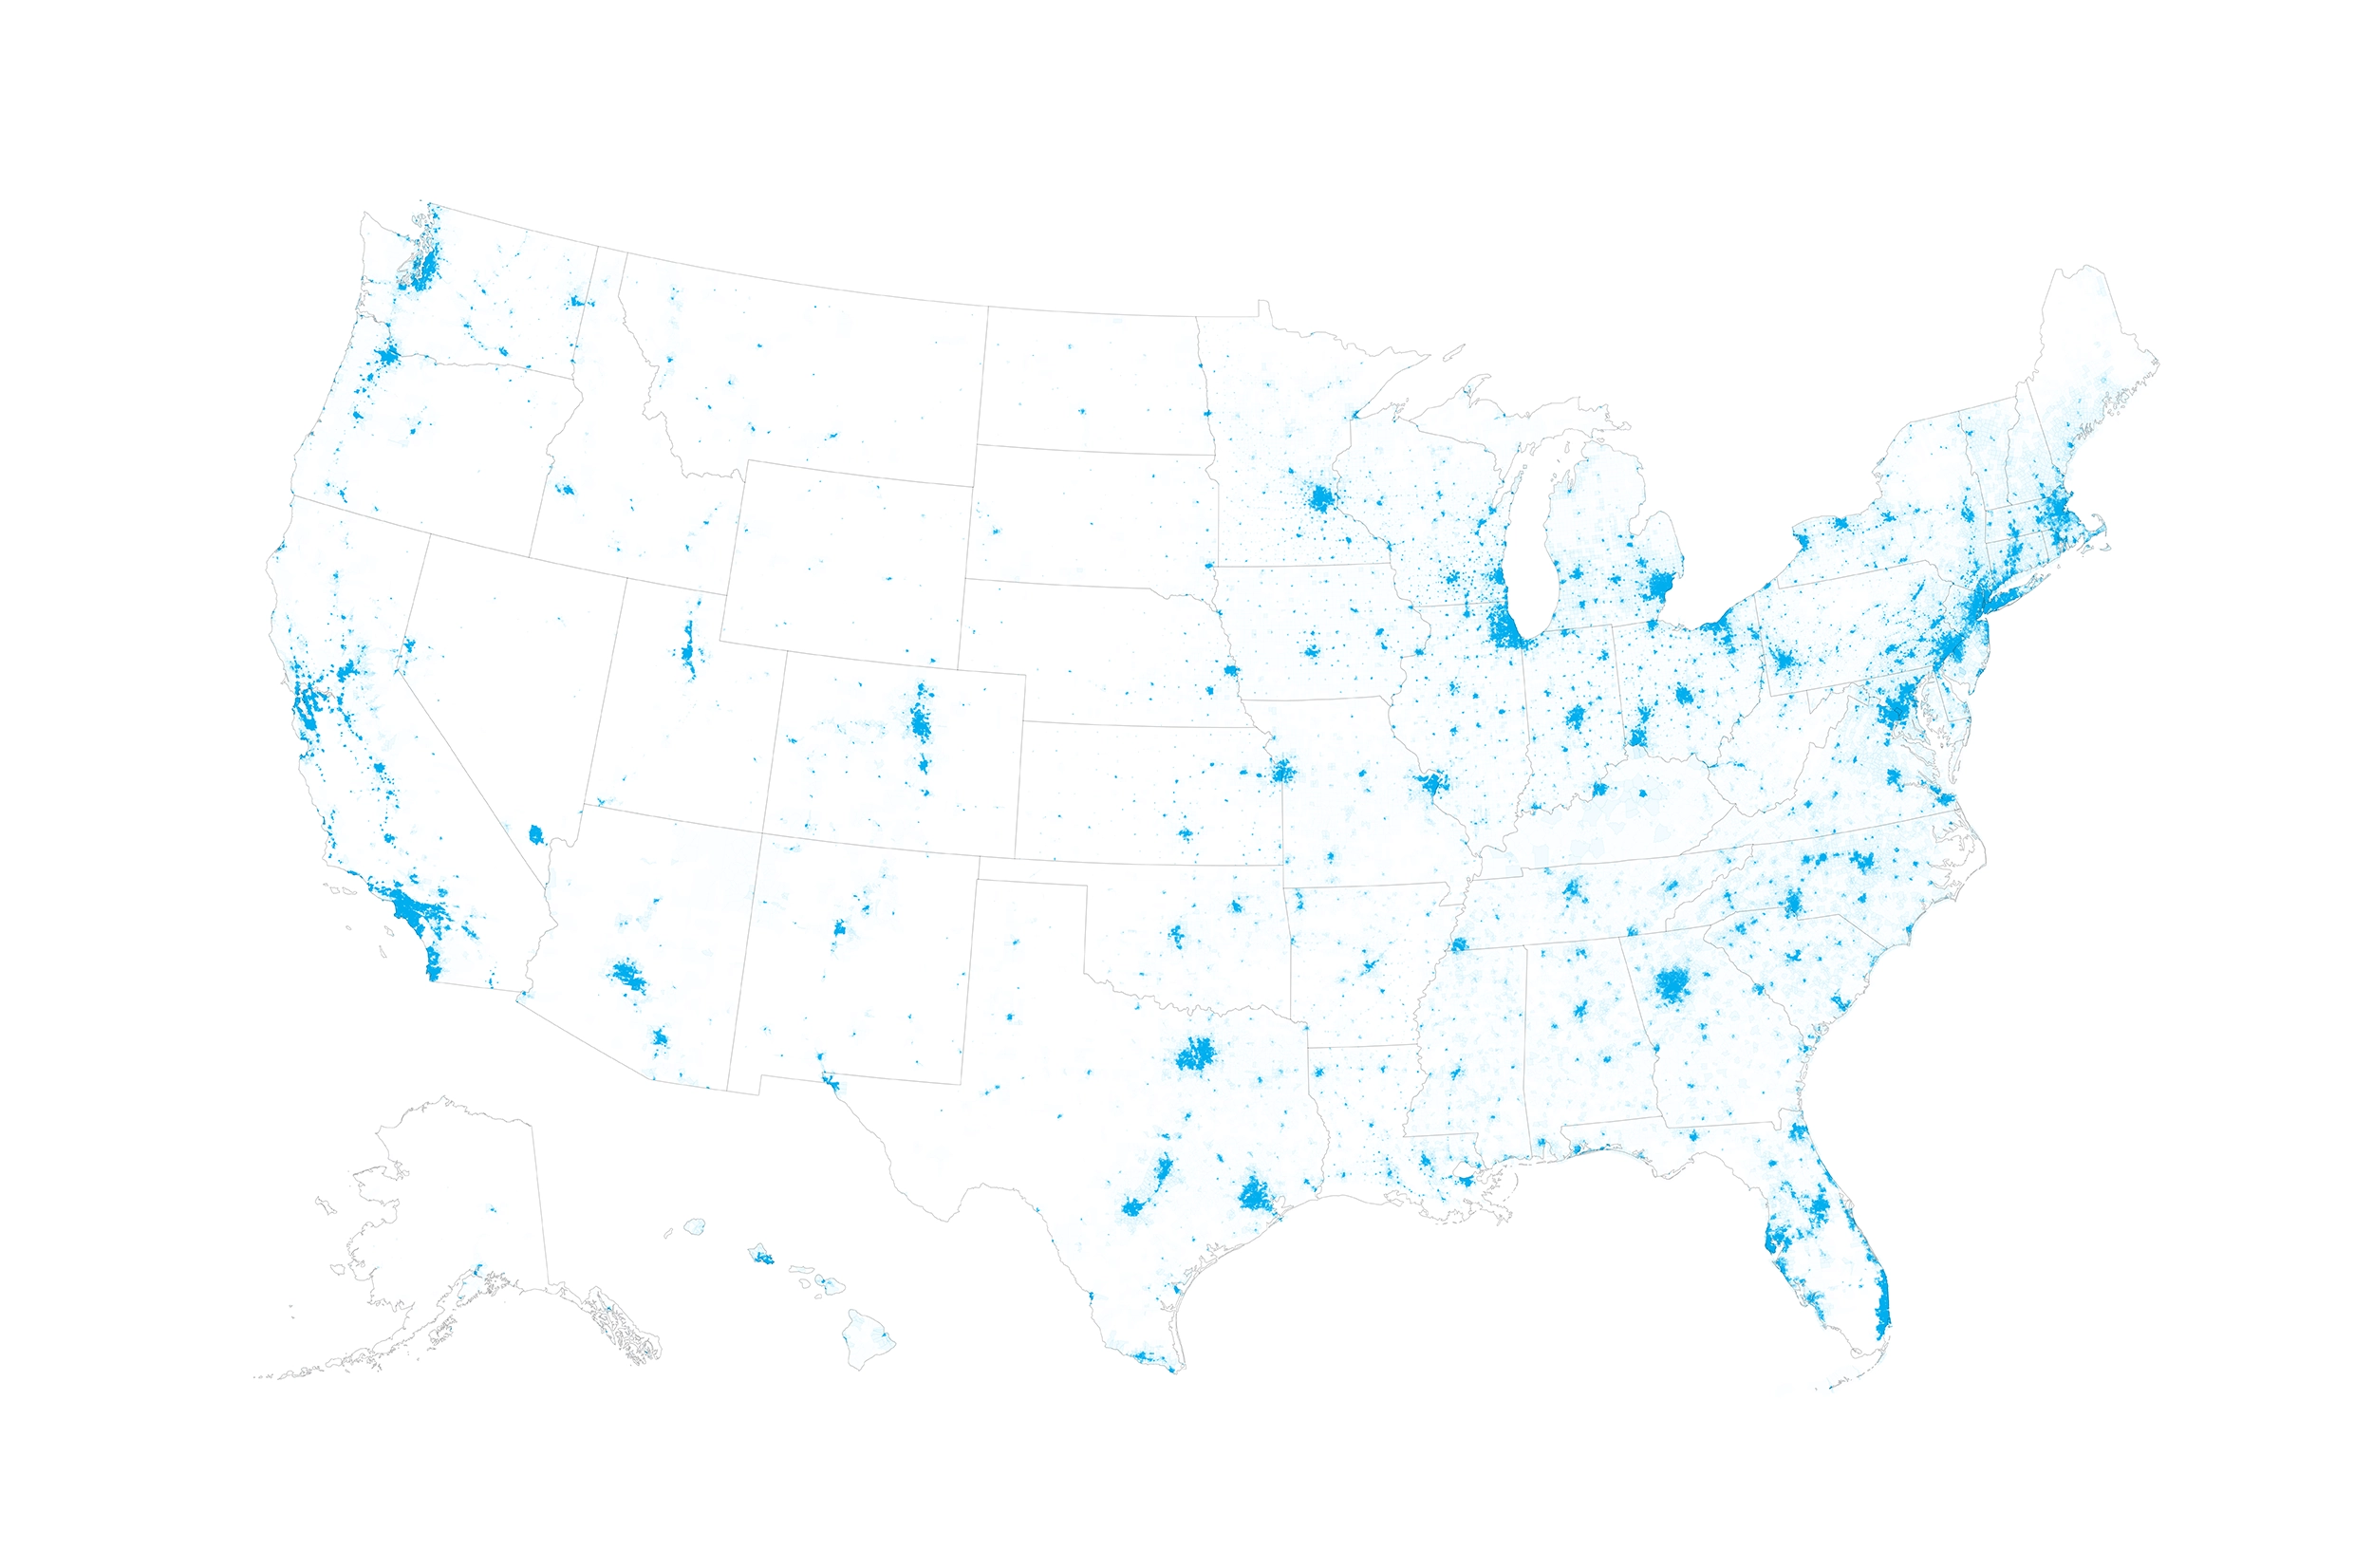
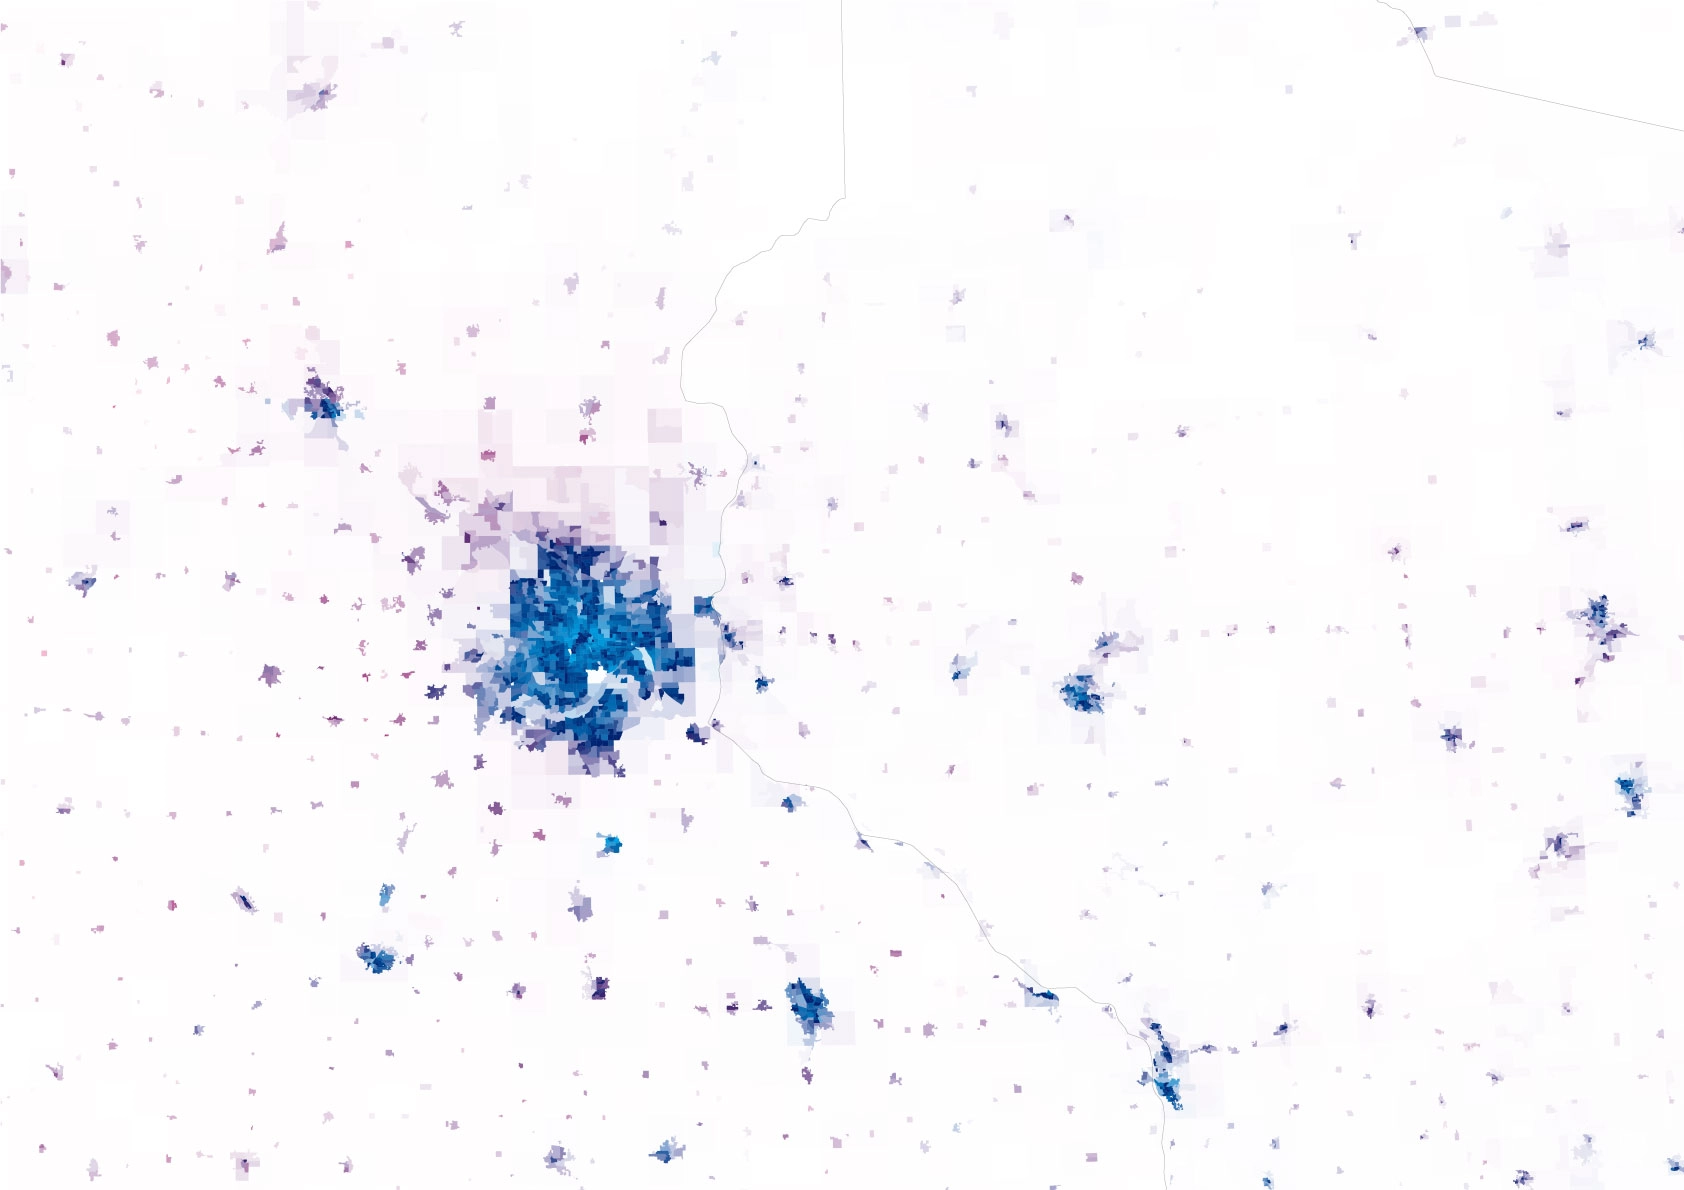
By land area, the country looks “red,” as seen in now-familiar voting maps that color in precincts based on their popular vote. However, by population count, the US has already tipped decisively to “blue.” The precinct-level voting map looks the way it does—overwhelmingly red by area—precisely because of the combined effects of intensive urbanization and political sorting by population density.
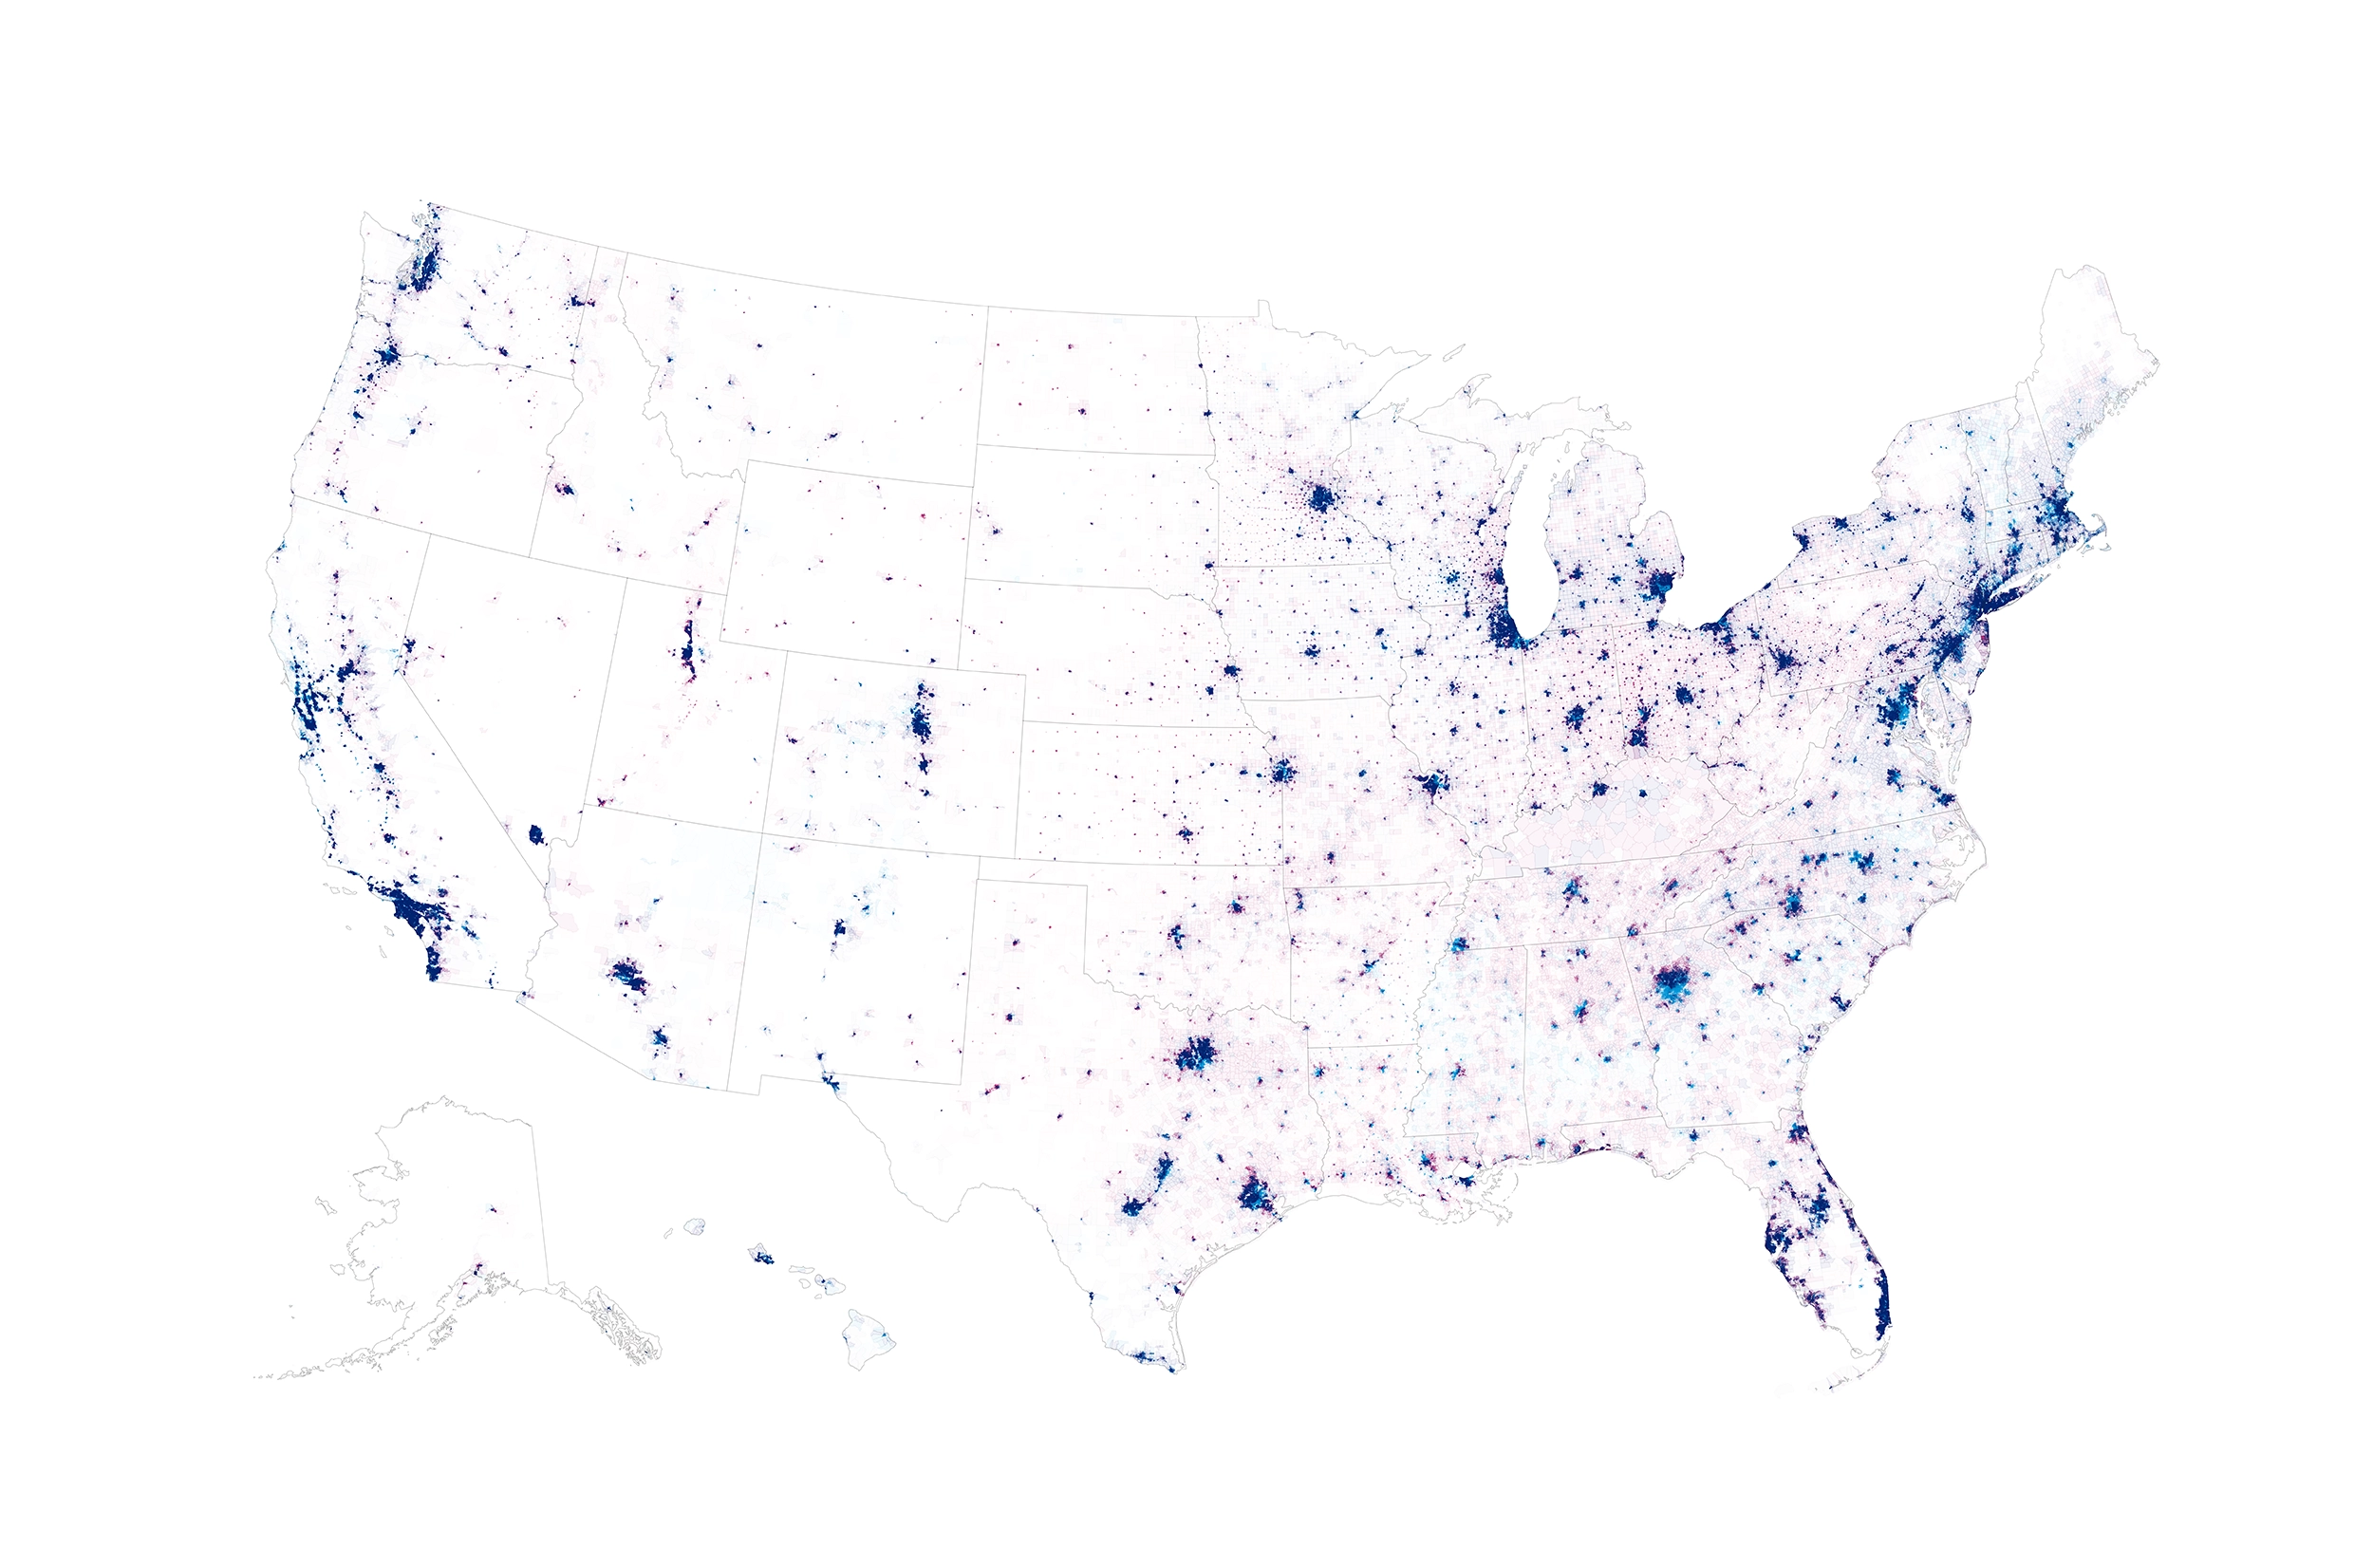
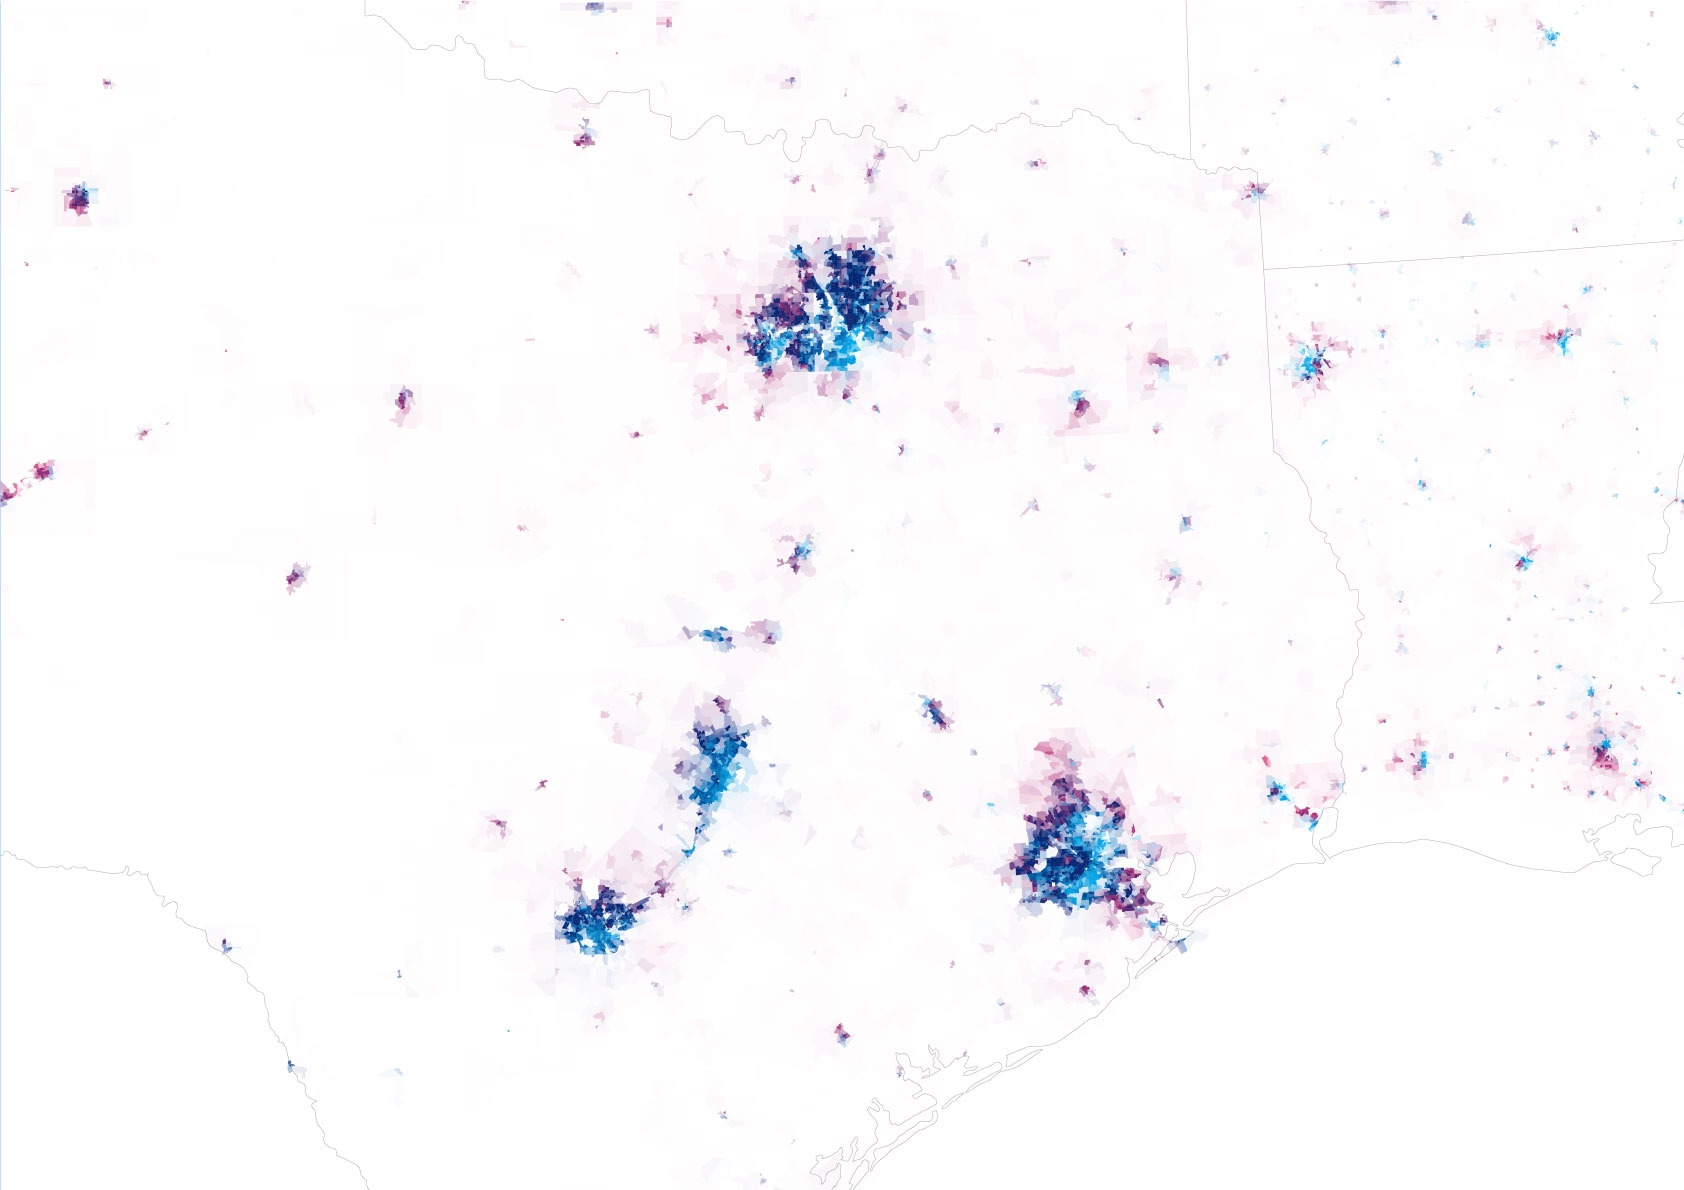
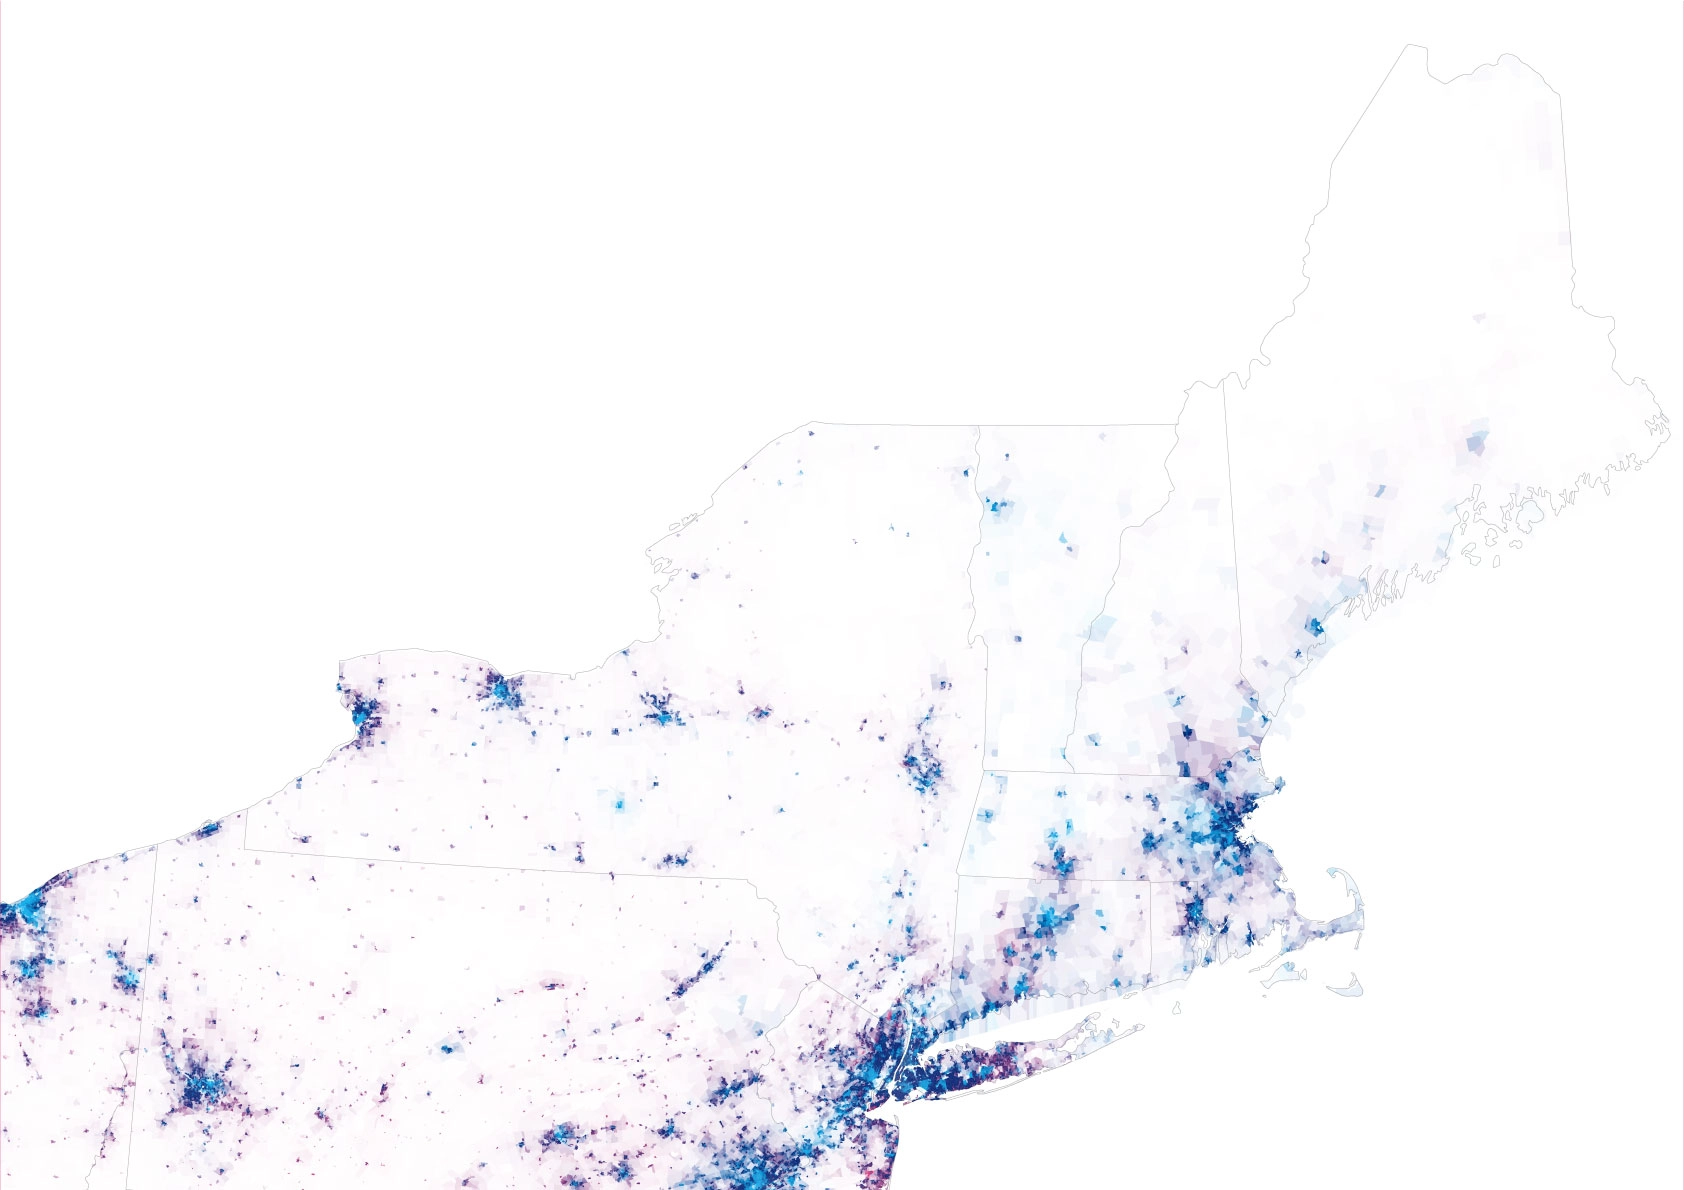
Arguably, a more informative way to visualize voting is to divide Democratic and Republican precinct votes by area. This is a more faithful rendition of the popular vote—approximating the pointillist image we’d see if every person were represented by a tiny red or blue dot. 23 Red and blue votes can be visualized separately, or overlaid to form a single image, with the two colors mixing to produce purple in the most contested areas. Although both red and blue votes are scarce in the deep countryside (because people are!), red votes are comparatively far more common in rural places, giving them a diffuse red hue—as is especially evident east of the Mississippi, where more of the countryside is settled. Major cities, though, are invariably more blue than red, whether they’re on the East or West Coast, in the Midwest or in Texas. Small towns are typically much redder, though, with occasional exceptions like Ithaca, New York (not coincidentally, home to Cornell University).


Kansas City
St.Louis
Indianapolis
Louisville
Minneapolis
Milwaukee
Chicago
Detroit
Cleveland
Albany
Boston
Springfield
Providence
Hartford
Ithaca
Philadelphia
New York
Baltimore
Washington

Minneapolis
St. Paul
Fort Worth
Dallas
Austin
Houston
San Antonio
Sacramento
Santa Rosa
Fresno
Stockton
San Francisco
Oakland
Palo Alto
Fremont
San Jose

Hartford
Albany
Boston
Buffalo
Rochester
Syracuse
Springfield
New Haven
Providence
Dayton
Toledo
Fort Wayne
Indianapolis
Cincinnati
Columbus
Louisville
Cleveland
Lexington
St.Louis
Chicago

Oneida
Poughkeepsie
Kingston
Ithaca
Corning
Elmira
Utica
Albany
Buffalo
Rochester
Syracuse
Binghamton

Unfortunately for progressive people, by apportioning representative voting and legislative power by geographical area, the American electoral system gives a lot more political power to the rural population. Unless the rules change, US politics will always lag significantly behind the country’s demographics.
The unequal weight of the urban and rural vote also paints a stark picture of the real legacy of white supremacy in the United States. When Black, Native, Asian, and Hispanic people were systematically excluded from or pushed out of farming to create a “white countryside,” they were not only deprived of income, the ability to accumulate wealth, and a legacy to pass on to future generations; they and their descendants were also excluded from political representation in the very places where votes carry disproportionate weight. In cities and suburbs, a long history of voter suppression and disenfranchisement targeting Black and other minority communities has been well documented. But even if a Black person manages to vote in the city, their ballot counts for only a fraction of what it would have had they cast it in the countryside. Hence, rural “whitening” has had an even more profound effect on national politics than urban redlining. And as the countryside continues to empty out, the relative voting power of the more homogeneous populations remaining there only continues to increase.
_(14596177519)_The_Georgetown_elections,_the_Negro_at_the_ballot-box_(cropped).webp "Cartoon of a black man placing a ballot, surrounded by white men grimacing at him and staring at him distrustfully. A banner says “The White Man’s Ticket.”")
ive seen several examples of the electoral college proving that not every vote matters. how can someone get more votes by the people who politics is supposed to serve yet the person with less real votes ends up being the winner. it taught me that voting is pointless and my opinion doesnt matter. 24
A 26-year-old white man from Citra, Florida.
A 35-year-old woman from Columbus, Ohio, who in describing herself notes, “My father is Nigerian and my mother is Native American and Black European. I do consider myself African American, not Black.”
A 36-year-old man from Oxford, Mississippi.
A 56-year-old man from Laramie, Wyoming.
Hence technically “Sharia law” is a redundant phrase, like “pizza pie” or “panini sandwich.” Pro tip for non-Italian speakers: pizza already means “pie,” and panino, the singular of panini, already means “sandwich.”
Though in fairness, at least half of American Jews are secular to the point of being agnostic or atheist, and only a small minority take Jewish law seriously. (See Pew, “Jewish Americans in 2020,” 2021, link.) Antisemitism nonetheless still exists, and may even be resurgent, as suggested by the substantial number of people, both urban and rural, answering “yes” to the question “Are Jewish interests overrepresented in Washington?”
Cross, Califf, and Warraich, “Rural-Urban Disparity in Mortality in the US From 1999 to 2019,” 2021. Native Americans were the only other American demographic group studied whose mortality also increased from 1999 to 2019.
Deloria, Custer Died for Your Sins: An Indian Manifesto, 1969; Banner, How the Indians Lost Their Land: Law and Power on the Frontier, 2007; Farrell et al., “Effects of Land Dispossession and Forced Migration on Indigenous Peoples in North America,” 2021.
Dedman, “The Color of Money,” 1988.
Rosenberg and Stucki, “How USDA Distorted Data to Conceal Decades of Discrimination Against Black Farmers,” 2019.
Horst and Marion, “Racial, Ethnic and Gender Inequities in Farmland Ownership and Farming in the U.S,” 2019.
Smith and Trevelyan, “The Older Population in Rural America: 2012–2016: American Community Survey Reports,” 2019.
A 33-year-old man from Aurora, Colorado.
A 46-year-old man from Niagara Falls, New York.
As usual when the error bars are large, these percentages are far from exact; still, the qualitative difference between 2016 and 2020 is obvious and dramatic.
Even New England’s famously bucolic liberal arts colleges behave, in effect, like small, dense, cosmopolitan cities: They bring together young people from a wide geographic area (including international students) and concentrate them in a small area. Predictably, the resulting politics are very progressive, as the close-up voting map of Ithaca, New York (the home town of Cornell University), later in this chapter illustrates.
Azrael et al., “The Stock and Flow of U.S. Firearms: Results from the 2015 National Firearms Survey,” 2017.
Jo et al., “Spatial Patterns of Close Relationships Across the Lifespan,” 2014.
Dunbar, Friends, 100–101, 2021.
A 55-year-old from Raleigh, North Carolina.
Graham, Haidt, and Nosek, “Liberals and Conservatives Rely on Different Sets of Moral Foundations,” 2009.
Stewart and Morris, “Moving Morality Beyond the In-Group: Liberals and Conservatives Show Differences on Group-Framed Moral Foundations and These Differences Mediate the Relationships to Perceived Bias and Threat,” 2021.
To math nerds: This normalization allows a sum or integral over any given area to faithfully count up the number of votes within that area. Equivalently, it makes the map’s overall appearance not depend on the spatial resolution over which vote counts are aggregated.
A 35-year-old from East Windsor, Connecticut.