Natureculture: a playful hybrid word, coined by Donna Haraway, meaning “a synthesis of nature and culture that recognizes their inseparability in ecological relationships that are both biophysically and socially formed.” 1 Just as urgently as we need to understand the inseparability of humanity from the rest of nature, we also need to understand that human nature and culture are inextricable.
What do the data have to say about the natureculture of sexual attraction? Let’s begin with the basics. In 2015, the US Census estimated that only 3.8% of the population are LGBT, but for a variety of reasons—likely including concerns about anonymity—this number falls well short of reality. A 2017 Gallup poll found that 4.5% of adults in the US identify as LGBT—5.1% of women, and 3.9% of men.
This “1 in 20” number has been widely cited, and is roughly comparable with the way older adults responded in the survey. However, looking across ages, a sharp decline in traditional heterosexuality is evident among the young. While nearly 95% of 65-year-olds report being heterosexual, only 76% of 19-year-olds do. This is an enormous change, and alarming to some: from 19 out of 20 at the older end to only 3 out of 4 young people!
This graph and others like it illustrate why it’s so important to break such statistics down by age, and where possible, to use smaller age bins at the younger end of the scale, where the changes are often most rapid. Especially in highly developed countries like the US, the population is heavily skewed toward older people. Averages will thus be dominated by those older people and won’t reveal how different the numbers are among the young. Yet arguably, the statistics of the young may tell us more about the shape of the future.
For younger women, it’s not even clear that sexual and romantic attraction exclusively to men (which I’ll abbreviate to “heteronormative attraction”) is a majority at all. The data show heteronormative attraction among women falling all the way to 50%, with the error bars suggesting that the real number might be even lower. As a 29-year-old woman from Alpharetta, Georgia, wryly put it, “Nowadays, being heterosexual is in the minority. Just an observation.” Although the numbers for men aren’t quite so dramatic, a 58-year-old bemoaned that he was “VERY unusual. I am a male that was born a male and is heterosexual. You never [hear] of people like that anymore. No really.”
You may find these numbers hard to believe, especially if you’re over 40. For two obvious reasons, our intuitions can lead us astray. First, we tend to associate with people in our own age cohort. Second, unlike hair length or height, we can’t generally tell someone’s sexual orientation at a glance. Talking about it outside a close friendship can be socially taboo, and, as with handedness (but more so), a minority status generally carries stigma. These observations apply especially among older people, amounting to a recipe for rendering the minority invisible, much as for non-monogamy.
Still, in recent years, we’ve seen high-profile public debates about topics such as the legalization of same-sex marriage, the status of gay people in the military, and trans rights. It’s easy, then, to see how someone in an older or more conservative cohort might harbor the impression that a lot of fuss is being kicked up by a tiny but vocal minority. Within such a cohort, even a person belonging to a minority might dramatically underestimate its prevalence, since they’re likelier to be closeted and not know—or not know that they know—anyone else like them. This puts in context occasional comments like the following, from a 58-year-old in North Carolina:
Yes, I am normal. I just wanted to mention this to the researchers as this represents 97% of the general population. I think the Trans/gender fluid people blew their wad and lost because of after 20 years of being beat over the head by the homosexual agenda, people are sick of the brain washing. I want the researchers to know just how normal [people] feel about this gender foolishness. These people are mentally retarded and they need to shut up and get out of everyone’s face with their personal problems. People just want them to shut up and get out of the way. Enough of them and their idiocy. They are mentally ill people who need to be slapped back into their proper place of being and that is not catering to their stupidity and allowing these fools to set public policy. We don’t care what they want. They should be institutionalized.
This jeremiad against the “homosexual agenda” ends with a cheery “Great survey.//Thanks.” Hateful responses are less common, though, than bemusement or plain bewilderment, like that of a 63-year-old straight man from Pulaski, New York, attracted exclusively to women, who wrote, “I don’t know exactly what many of these terms mean. I am a definite no on those. [N]othing that needed extra explaining thanks.”
Despite overwhelming heterosexual majorities among older people, the “heteronormatively attracted” curve never goes above 80% at any age—that is, significant numbers of people, at all ages, identify as heterosexual but don’t report being exclusively sexually and romantically attracted to the opposite sex.
Some of them are not sexually attracted to either men or women. Though these numbers are comparatively small, they aren’t negligible, amounting to about 3.5% among the young and gradually dropping to about 2% by age sixty.
While both the overall percentage and the difference between men and women shrink with age, notably more women than men report a lack of sexual attraction to anyone. A similar pattern holds for asexuality, meaning a low or absent sex drive.
In this area as in some others, asexual respondents often express different views about whether they see their minority status as a medical abnormality, an identity, or somewhere in between. A 22-year-old woman from Illinois wrote of her asexuality, “I’m tired of people saying I’ll grow out of it or thinking there’s something wrong with me.” Contrast her response with the way an asexual 27-year-old from Florida characterizes her asexuality as a dysfunction: “I have hormone issues and thus greatly reduced sex drive.”
Of course it could be said that all of us have sexual urges influenced by our hormone levels, and our hormone levels can be welcome or prove inconvenient in any number of ways. We can believe our hormonal settings are normal or abnormal, wish they were different or embrace them, think of them as a malady or as part of our identity. There is no objectively right answer.
Evidently asexuality is less common—or, judging by the previous graph, less acknowledged—for the youngest cohort, even among those who don’t find themselves attracted to anyone. Identifying the absence of something can be tricky for a young person, in that it’s hard to distinguish not having the psychological or hormonal “circuitry” for strong sexual attraction from simply not having experienced it yet: “I think I’m asexual, but I don’t even know.” 2 Or, in the words of a 23-year-old woman from Michigan,
I’ve identified myself as aromantic/asexual on this survey because I have never been attracted to anyone in my life. However, I am constantly questioning this and am unsure if this is influenced by my lifestyle/health issues, and if this will change in the future.
For a 24-year-old from New York, this is precisely what happened:
If it’s worth anything, I’ve mistaken myself for asexual. Turns out I’m just a late bloomer and I hate it. I mean, it feels good, but it’s so much easier not having sex on my radar much at all.
Asexuality peaks in the early twenties at about 4% of men and nearly 5% of women, then settles down to about 3% by age thirty. The gap between women and men is large between ages thirty and forty, though, when twice as many women report being asexual.
Multiple factors are in play here. Some older people lose interest in sex or romance, despite still thinking of themselves as heterosexual; their identity hasn’t changed, but their drives have. As a woman from Oregon explained,
The older I get (67) I seem to feel less and less emphasis on how I look and more emphasis on how comfortable I am as in comfortable clothes, less fuss about how I look. Of course ones libido takes a hit after menopause, but for me that is not a great loss as my husband has lost his too due to illnesses and medications. One finds in old age that sexual orientation and its importance gives way to what matters in your life more such as love for life in general and those around you.
A 70-year-old woman from East Hartford, Connecticut, put it more succinctly: “no longer interested in men or anyone in that way.” On the other hand, younger people may identify as asexual despite having some sexual or romantic feelings, or engaging in sex:
I am asexual but have sexual relations with who I love/am in a relationship with. I do not have sexual urges though. 3
Like any other identity, asexuality is defined socially, based on the labels and norms of a peer group. These expectations change with age, and for a 23-year-old woman today, lacking sexual urges is notable, while for a 70-year-old, it may not be.
Interestingly, some young respondents identify as both asexual and as bi- or pansexual. 4 This can be confusing to those of us who think of sexuality in terms of a simple dial, with “gay” at one end, “straight” at the other end, and “bi or pan” somewhere in the middle. In the 1940s, pioneering sexologist Alfred Kinsey and his collaborators came up with just such a model, which came to be known as the Kinsey Scale. Even today, it’s often invoked as a counterargument to the idea of attraction being binary, either strictly homosexual or heterosexual (“I’m around kinsey 4 lol,” wrote a 20-year-old from Poquoson, Virginia). The Kinsey Scale may be the archetypal “spectrum.”
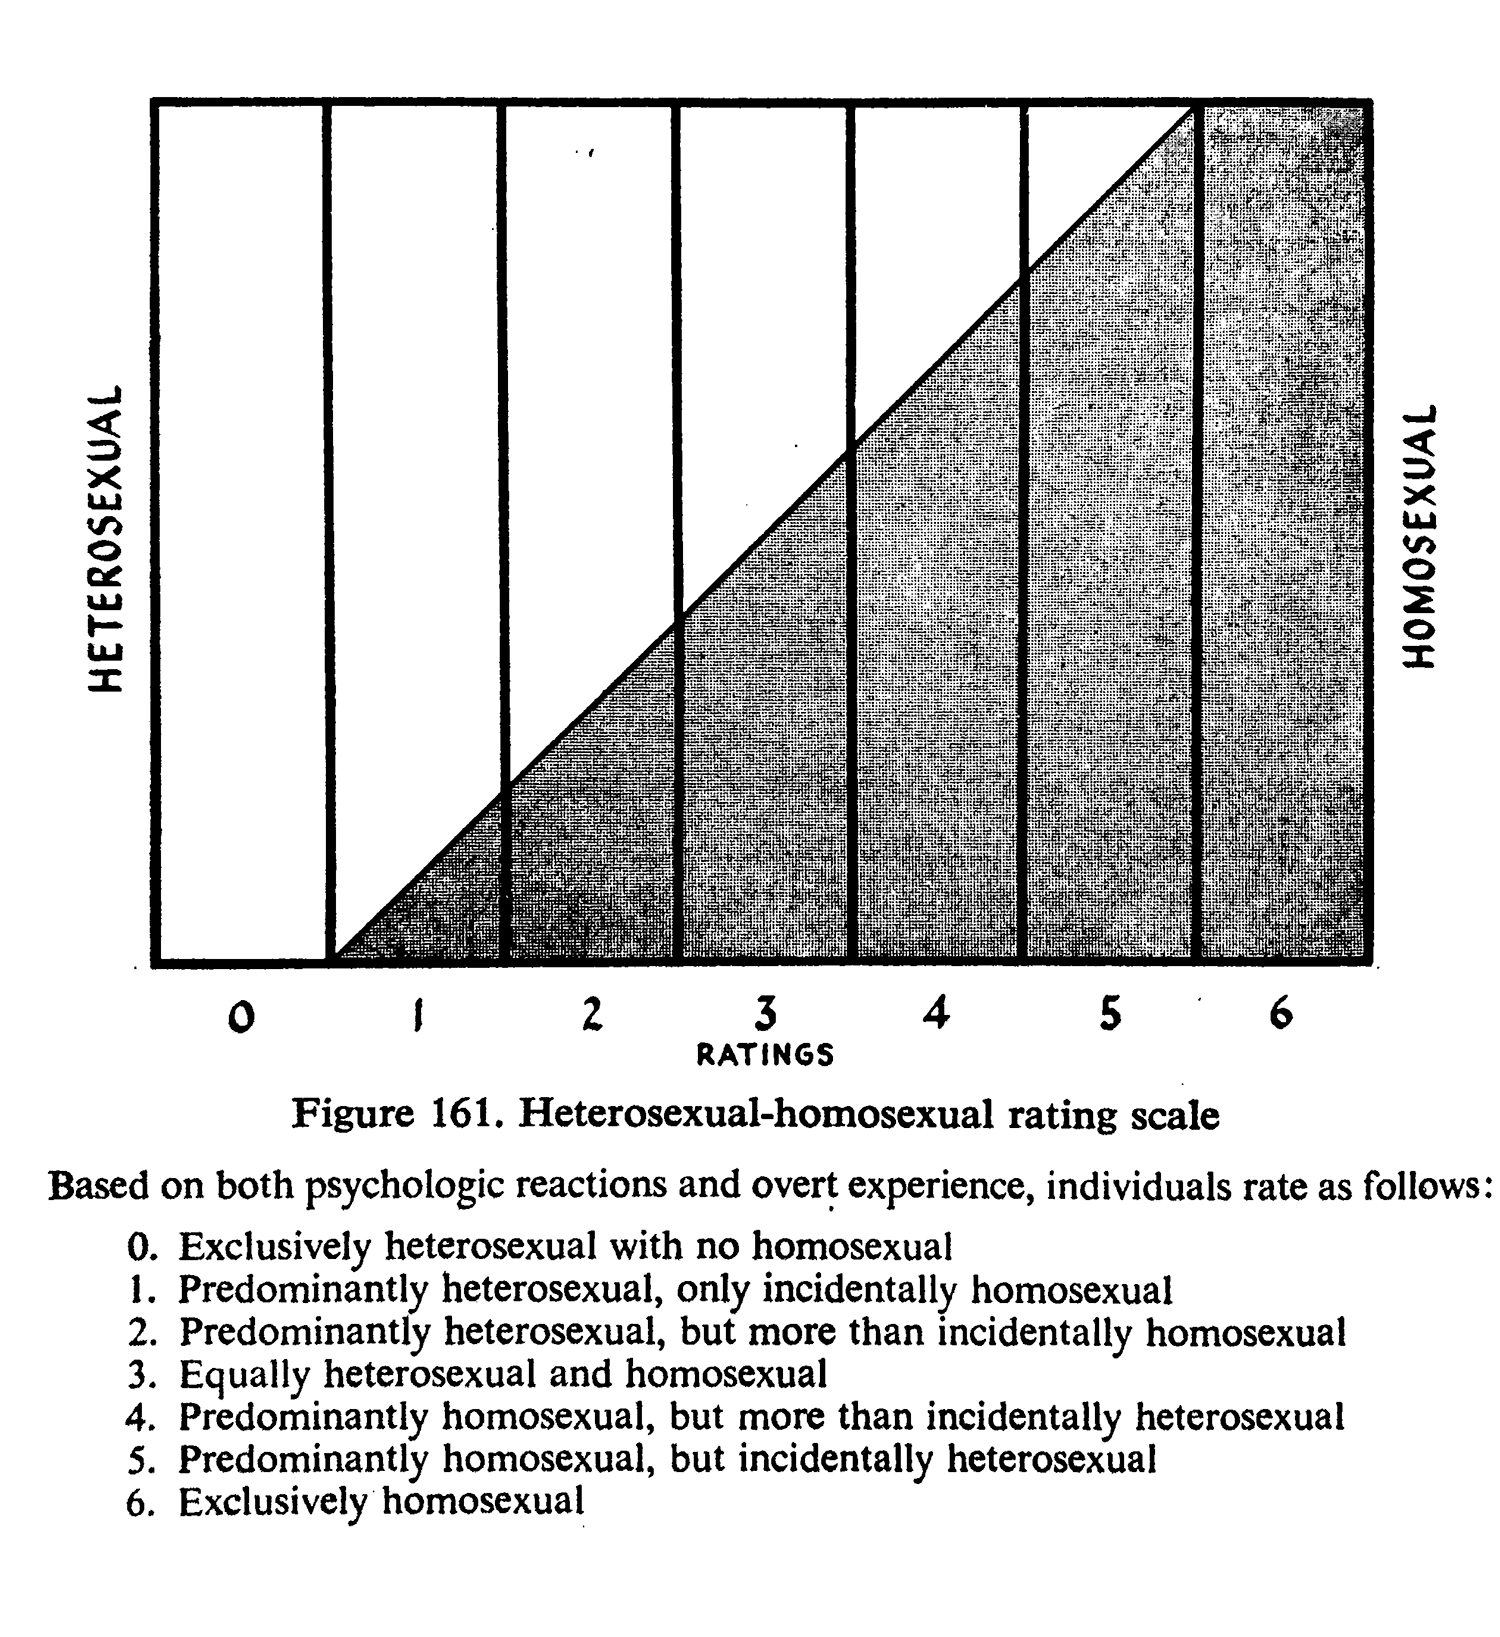
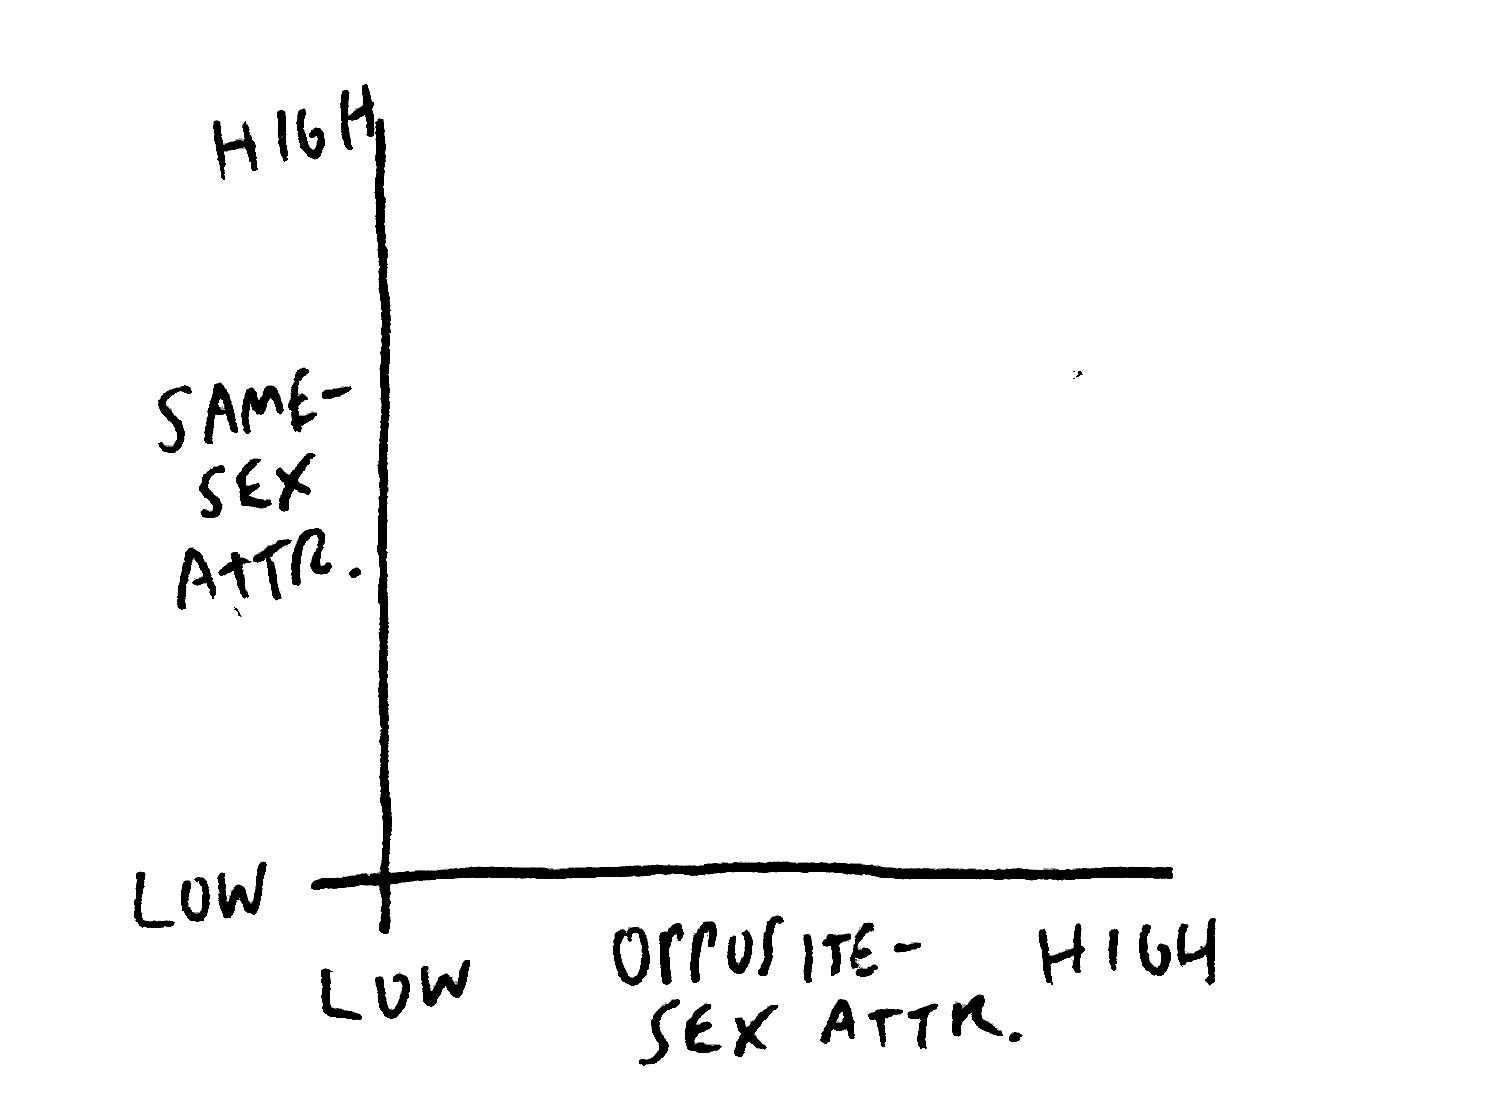
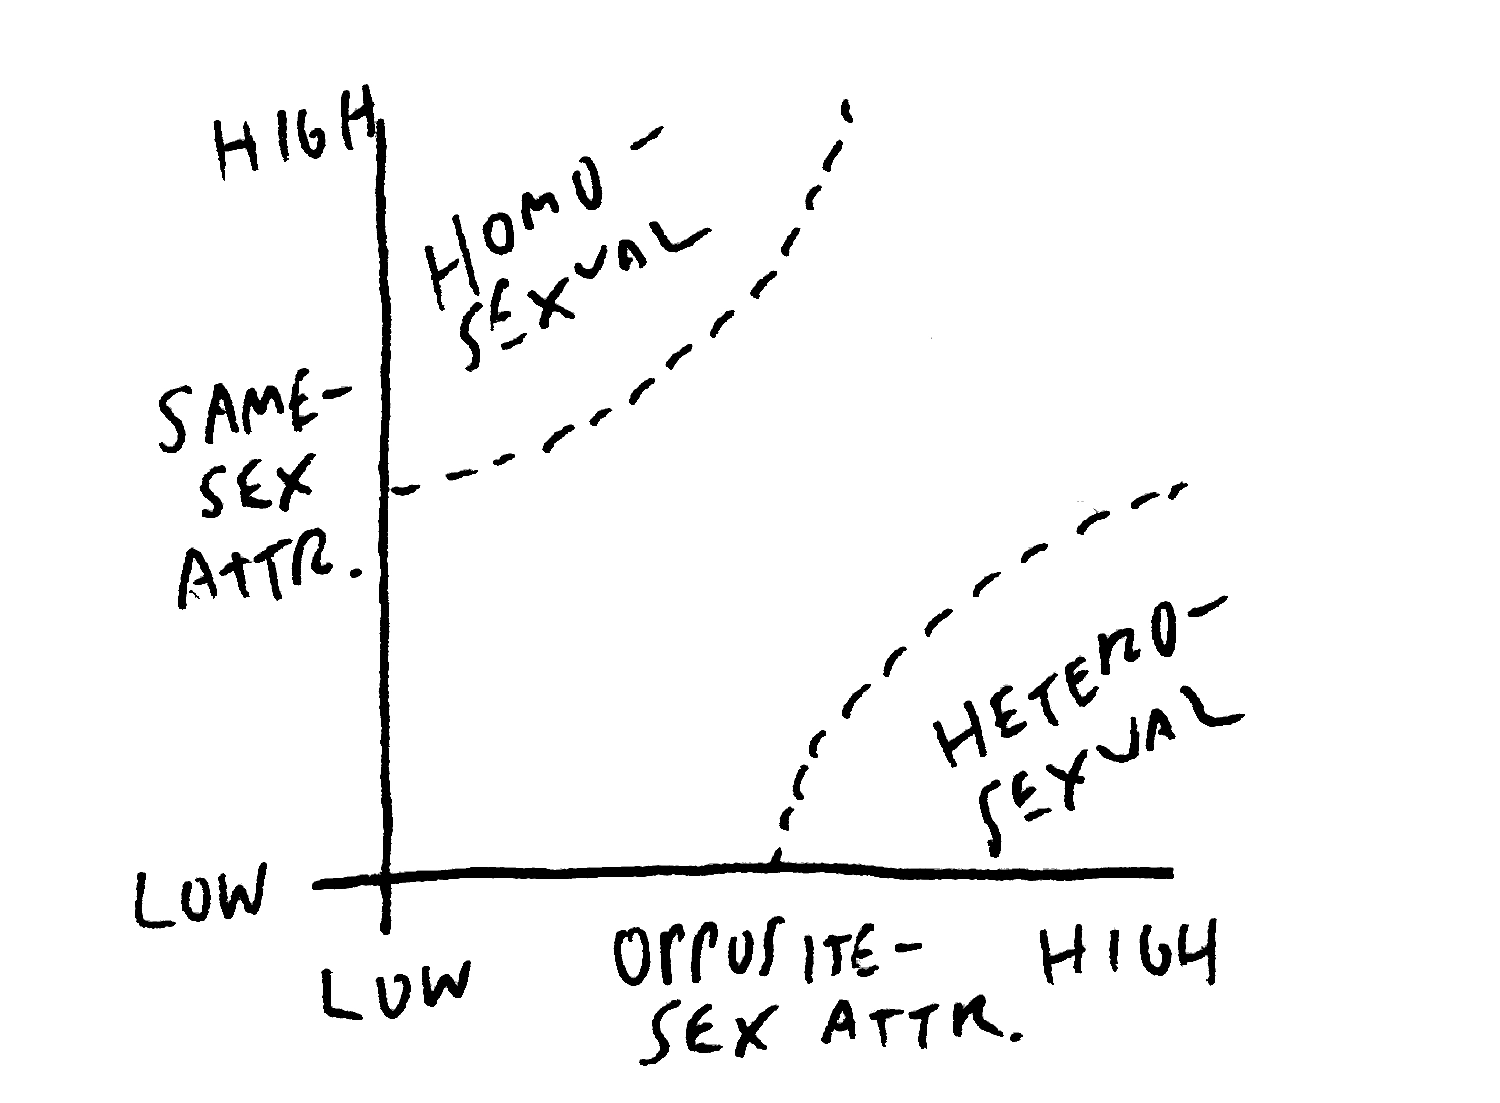
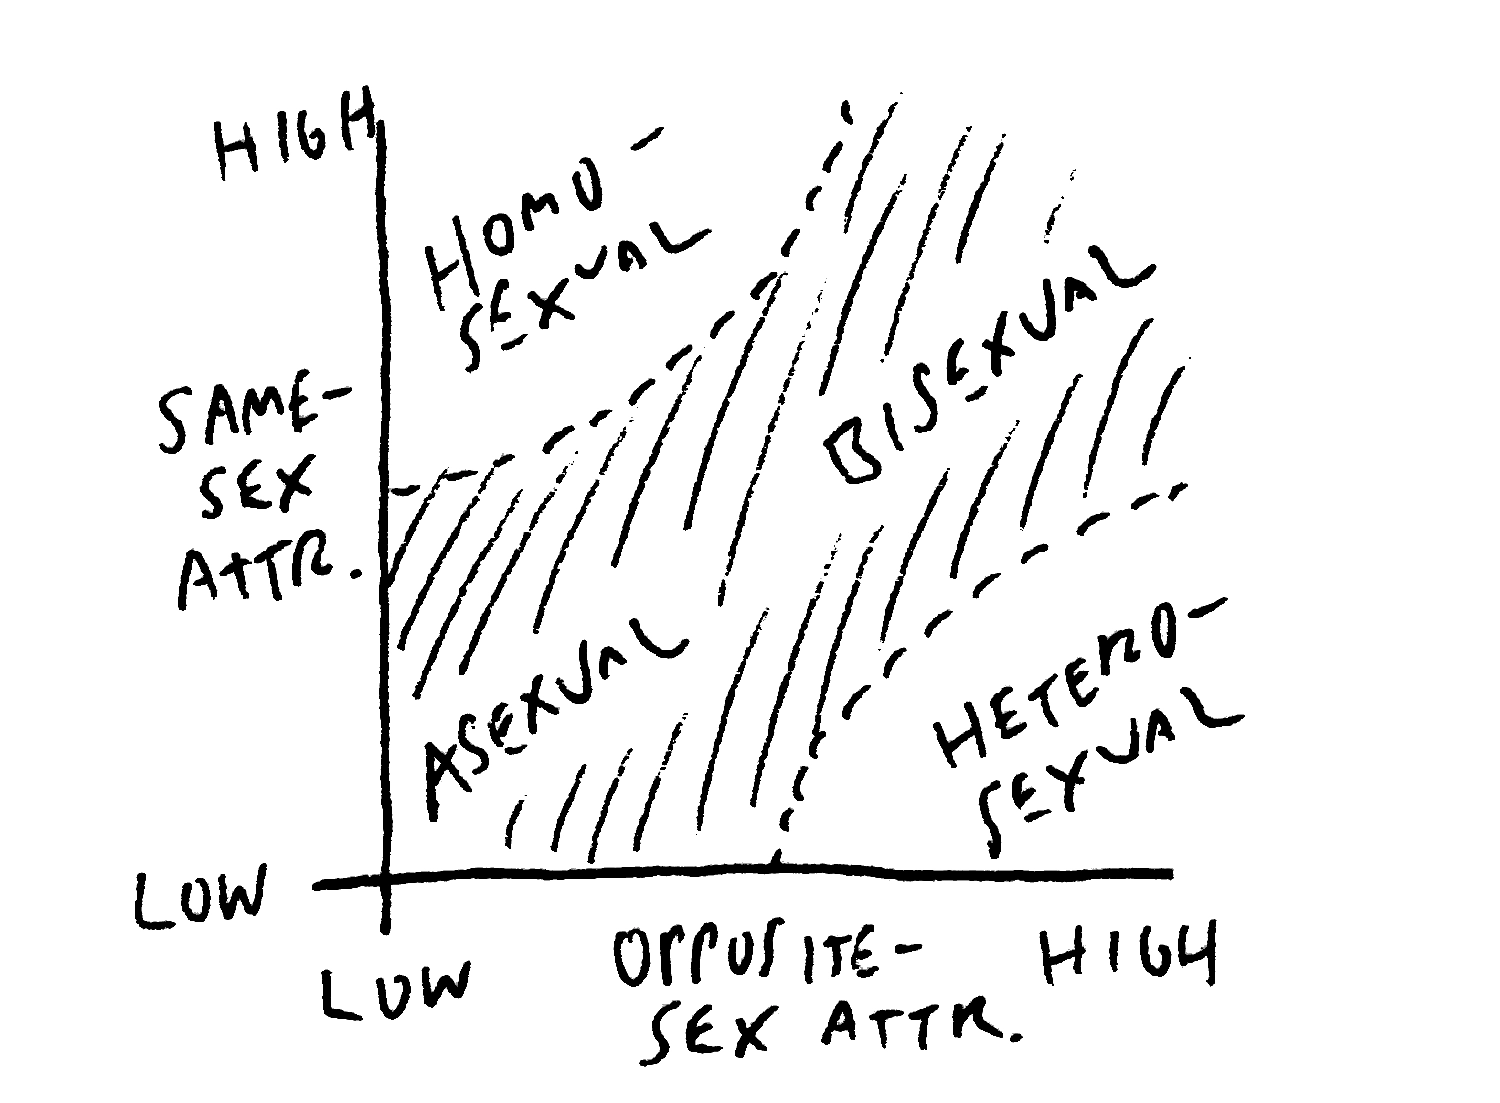
Although more nuanced than a simple dichotomy, the model falls short in many ways. Even when gathering their data, Kinsey and collaborators found that they had to define a special off-scale category that they called “X”—which today we’d associate with asexuality. The need for the “X” category illustrates a problem with thinking about orientation one-dimensionally: being less attracted to the same sex does not automatically make you more attracted to the opposite sex, or vice versa. A two-dimensional sexual attraction scale, considering same-sex and opposite-sex attraction as independent variables, accounts for asexuality more naturally, and doesn’t presume a zero-sum tradeoff between heterosexuality and homosexuality. 5
Models are always simplifications, and they always smuggle in assumptions. Hence the two-dimensional picture, like any model, still remains incomplete (for instance, it presumes that same and opposite sexes can be clearly defined, which as I’ll explore further in Chapter 11, isn’t always the case), but at least it allows an asexual “X” to be placed on the map—somewhere near the lower left—rather than awkwardly off it. The model also reveals the way asexuality and bisexuality can be regarded as a continuum, ranging from the lower left to the upper right. Describing his position near the asexual end of this continuum, a 39-year-old from Moorhead, Minnesota, wrote,
I could very easily see myself as registering as either asexual—which is a thing, or possibly pan. It’s not quite as clear cut as all that. I don’t really have a preference, except that I’d rather avoid sex altogether.
Both the Kinsey Scale and its more nuanced two-dimensional cousin fall short in assuming a person can be pinned down to a fixed point on the map. Even setting aside daily ups and downs, life is long, and for most people, sexual attraction waxes and eventually wanes; a life is better described as a trajectory than as a fixed point.
How we identify tends to remain more stable than our actual feelings or behaviors, though. There’s social value in maintaining (and presenting) a consistent self-concept, independent of time, place or context—especially in WEIRD societies—even if that self-concept is at odds with facts on the ground. 6 Given the stigma of asexuality as a minority identity, it’s unsurprising, then, that many older people with little or no libido don’t identify as asexual, or, indeed, as anything other than “normal”—so, usually, heterosexual.
Presumed heterosexuality by default also holds for many older women despite non-heteronormative impulses or inner lives, even if unrealized or long-buried. A 67-year-old woman from Mohawk, New York, reminisced,
I have had sexual relationships with women three times when I was in college, but I don’t know if that qualifies me as bisexual or not? It hasn’t happened since.
In another characteristic comment, a 41-year-old woman from Salt Lake City wrote,
I am married and only recently realized an attraction to women, also. Wonder if religion of my upbringing held that part of me back and so I never really experimented.
The frequency with which women, especially, express these feelings when asked anonymously is a topic I’ll return to in the next chapter.
In addition to sexual attraction, the survey also asks questions about romantic attraction. Although they’re often in alignment, sexual and romantic attraction work differently for some people. The breakdown of romantic attraction by age and gender certainly looks very different from sexual attraction.
As with lack of sexual attraction, the numbers converge to roughly 2% for older respondents, but at younger ages a lack of romantic interest is far more prevalent among men—rising above 12% for the youngest men. Men appear to become more interested in romance as they get older, while women become less so.
Differences like these between younger and older people can be explained in two very different ways: as an effect of the respondent’s age at the time of the survey—let’s call this the “age hypothesis”—or as an effect of their generation—the “era hypothesis.” According to the age hypothesis, any variations are a function purely of the respondent’s age, so if the survey were run again in 20 years, the resulting graph would look exactly the same. As a 57-year-old from Cold Brook, New York, put it,
We were once the younger generation and some of us were wild and crazy but not all. In so many ways the different generations are more alike than people want to believe.

The age hypothesis can be thought of as the “nature” end of natureculture. It’s hard to imagine it doesn’t apply at least to some degree, and for some variables. For instance, declines in sex drive over time must be at least partly due to the biology of aging, and intuitively, it seems likely that young men have always been more interested in sex than in romance. 7
The era hypothesis, on the other hand, would hold that each individual’s response to a survey question will remain constant as they age—in which case, if someone were to rerun the same survey with respondents drawn from the same population in 2040, the whole graph would shift to the right by 20 years, alongside a new cohort of younger respondents on the left with potentially different answers (and a vanishing cohort on the right who are no longer among the living). The era hypothesis is also the expected behavior for variables one might assume correspond to some essential, changeless property of an individual’s body, identity, or personality, such as race, gender, or sexual orientation.
It’s impossible to disentangle age and era effects by looking only at the kinds of graphs shown so far. Making that distinction requires measuring responses over time as well as across ages.
Unfortunately, I don’t have 20-year-old survey data— I was barely out of college 20 years ago, and my research interests were very different back then. However, I’ve been working on this project long enough to have been able to run the gender and sexuality survey four times at yearly intervals, in December 2018, December 2019, December 2020, and December 2021.
The research still covers a relatively short period, and can only provide a local, noisy window on long-term trends. We may also be in a period of unusually rapid historical change. Nonetheless, the results are interesting. For variables like height and weight, the data precisely follow the age hypothesis, with the 2018, 2019, 2020, and 2021 curves plotting these variables as a function of age lying right on top of each other (see the Appendix for examples).
I should note here that Mechanical Turk allows the experimenter to create and assign “qualifications” to workers, as well as offering an option to specify qualification requirements for performing a task. By assigning a qualification to everyone who took the survey in a given year, I was able to screen out those respondents in subsequent years; that is, Mechanical Turk did not offer them the survey if they’d already taken it in a previous year. Hence the 2018, 2019, 2020, and 2021 cohorts don’t overlap. 8 Nonetheless, I was able to verify that, even if the individual respondents each year were all different, the basic demographics of the population they were drawn from remained the same. Put another way, demographic variables behaved according to the age hypothesis. 9
So, upon comparing heteronormative attraction over these four years, do responses look like (a) a pure function of age, or (b) a pure function of historical era? Or, perhaps, (c) a mixture of the two? For many variables, including heteronormative attraction, the answer turns out to be a surprise: (d), none of the above.
To simplify comparison, I’ve combined the 2018 and 2019 data into one pool, and the 2020 and 2021 data into another, as well as using coarser age bins. This way, the graphs allow comparisons between two curves with smaller error bars, rather than four curves with larger ones.
Evidently, heteronormativity across age ranges is significantly lower in 2020–21 than it was in the previous two years, 2018–19. Incidentally, this suggests another reason the literature tends to overestimate heteronormativity in the US. Since survey data are always historical, their numbers—along with our perceptions—lag reality on the ground. The question is, how fast is that reality changing? The answer: very fast.
Keep in mind that any change over time is incompatible with the age hypothesis, which would hold that lower heteronormativity among the young is just about being young (i.e., perhaps experimenting or questioning more, before “figuring it out”). However, the data are also incompatible with the era hypothesis, which would predict that the 2020–21 curve ought to look like the 2018–19 curve shifted rightward by two years.
So, it’s not (a) or (b). What about (c)? That can’t be the case either, because if the data merely showed a mixture of age and era effects, one would expect to see a rightward shift over this period somewhere between the zero years predicted by the age hypothesis and the two years predicted by the era hypothesis. Instead, the 2018–19 curve would need to shift to the right by almost two decades to lie on top of the 2020–21 curve. The curves look consistent with a version of the era hypothesis in which time itself is fast-forwarding by nearly 10x! Seen another way, it looks more like the 2020–21 curve is a downward-shifted version of the 2018–19 curve, rather than a rightward-shifted one. What could this mean?
For one, it means that any preconceptions one might have about the essential or unchanging nature of people’s responses to questions like these—about same- and opposite-sex attraction—are wrong. In fact, it’s very difficult to find any questions relating to identity or behavior where the slow rightward shift predicted by the era hypothesis actually holds. Yes, the youngest people are different from year to year, but older people are changing their answers over time too, presumably in response to a changing social environment. Natureculture, indeed.
The data offer strong evidence of an effect sometimes referred to in the social sciences as “social contagion,” although the term of art is unfortunate. I prefer “social transmission,” since “contagion” connotes disease, whereas our human ability to learn from and be influenced by others throughout life is hardly pathological. Beyond its obvious negative connotations, “contagion” as a metaphor revives the old trope of “sexual deviance” and provides cover for new incarnations of “conversion therapy.” As legal scholar Kenji Yoshino has written in a widely cited Yale Law Journal article,
Even as the concept of homosexuality as a literal disease (i.e., a mental disorder) waned, a concept of homosexuality as a figurative disease (i.e., a disfavored social condition that was contagious) remained. […] The metaphorical contagion model captures a fundamental fear about homosexuality […]. Whether framed as contagion, as recruitment, as seduction, or as role-modeling, the fundamental fear about homosexuality is the apocalyptic “fear of a queer planet,” the fear that homosexuality can spread without being spread thin.
Because it so closely tracks popular fears, the contagion model has proved an extremely effective anti-gay rhetorical device. The utility of this conception of homosexuality is that it figures homosexuals as themselves engaging in a kind of conversion therapy, converting wavering individuals into gays. 10
Even as we reject the metaphors of “disease” and “contagion,” however, we should acknowledge that human beings do continually influence each other’s beliefs, behaviors, and identities through their social networks. That’s how culture works; it is, in the words of Joseph Henrich, “the secret of our success” as a species. 11 While the effect is often strongest among the young, perhaps because their uncertainty, plasticity, or susceptibility to changing social inputs is highest, social transmission is evident at all ages. We influence each other all the time, even when it comes to traits most people consider “essential.”
To return briefly to the previous chapter’s topic, a similar pattern is evident in the shift away from monogamy between 2018–19 and 2020–21 (though here, younger people may be reaching a lower plateau at about 70%; given the error bars, more years of observation will be needed).
The shift across this two year gap would correspond to even more than two decades of change under the era hypothesis. Much like the decline in heteronormativity, the decline in monogamy (one might call it “Morning Glory’s Prophecy”) can be attributed to rises in a number of alternative models and behaviors, all of which chip away at the historical norm.
Such rapid change highlights the power of modern human sociality as a kind of accelerated evolutionary engine. Consider: the era hypothesis can be understood as an upper limit on the speed of genetic evolution, since once we’re born, we’re stuck with the genes we have. 12 Generational turnover is also a limit on the speed of most learning in traditional societies, which typically involves younger people learning from their elders during a period of apprenticeship. While this allows humans to evolve skills and accumulate knowledge far in excess of our genetic inheritance, it does not allow us to break the generational speed limit.
When we become lifelong learners, though, and especially when older people can learn new tricks from the young, generational turnover no longer constrains the rate of cultural evolution. Urbanization, cafes, journals and newspapers, TV, the web, social media, and many other features of modern life seem almost tailor-made to boost cultural evolution both within and across age cohorts.
A comment on evolution is in order here. Remember the survey respondent I quoted at the beginning of this book, both bigoted and perhaps honestly alarmed by this same trend, writing, “What would happen to a animal species that went gay, I’ll tell you, they would all go extinct.” While my own feeling is that unbounded exponential population growth 13 is a greater threat to human survival—hence, if many of us did indeed “go gay” (or at least stop reproducing) now, we’d be improving our collective odds—there’s a valid observation lurking under the surface here.
Prodigious social transmission, together with intense competition between societies at every scale for thousands of years, has certainly boosted human fitness in the Darwinian sense; so much so that we’ve now achieved something like escape velocity from Planet Darwin. With plummeting mortality among the young and calories cheaply available, individual survival no longer depends so much on individual Darwinian fitness. 14
Nonetheless, the mechanisms of accelerated cultural evolution are still busily at work, tinkering with our sexuality along with our politics, our languages, our diet, our technologies, and everything else. Susan Blackmore, in her book The Meme Machine, 15 has referred to ideas that propagate as “memes,” by analogy with genes, hence to this process as “memetic evolution.” 16 It operates much faster than genetic evolution, and has a far larger palette of tools to work with: consider how long it took genetic evolution to develop flight, compared with how long it took us to invent airplanes, then evolve them into a Cambrian explosion of flying machines of all sizes and shapes.

This brings us in a full circle back to the question posed by the previous chapter: how “rational” are genetic and cultural evolution, really? We’ve already seen the dangers of teleology, which can cut both ways here.
Conservative people often argue that evolution, i.e. “nature,” is inherently rational because only the fit survive, while cultural evolution, unfettered by the survival imperative, is prone to all sorts of irrational excesses. Those making this argument tend to be reacting to a cultural development they disapprove of, whether recreational drugs, gay nightclubs, women’s colleges, or selfie sticks—in general, urban-first trends. Recall the phrenologist S.R. Wells from Chapter 6, for example, who railed against the “unphysiological habits and pernicious systems of education so prevalent at the present day, especially in cities,” subverting the “natural order of development.”

From the progressive or techno-optimistic perspective, the emphasis is instead on how humanity can now engineer rationally, correcting the arbitrariness (and, often, cruelty) of nature. Hence such wonders as: Braille, surgery to correct cleft palates, antibiotics, transfusions, birth control, and perhaps eventually, full editorial control over our own genome. It would be nice to edit out Huntington’s disease, sickle cell anemia, and other obviously undesirable legacies. Maybe that will mark the start of a takeover of genetic evolution by cultural evolution!
Looking dispassionately at these mirror-image arguments, it becomes clear that they both cherry-pick “rational” and “irrational” examples based on appeals to personal taste or values. Further, “rationality” isn’t particularly objective, no matter which way you slice natureculture.
Arguing that cultural evolution is always “rational” neglects the overwhelming number of cultural developments that really don’t serve some grand purpose. (If you insist on defending the utility of the selfie stick, try doing the same for the Tide pod challenge. 17 )
But the same is true of genes; consider the beautiful but absurd peacock’s tail, or the fact that vertebrate retinas are inexplicably wired back-to-front, requiring that our visual systems Photoshop out the big blind spots and nests of blood vessels we’re peering through. 18 In short, though genetic evolution is slow, the idea that it works “rationally” seems dubious. If it were, much of the strangeness, beauty, and impracticality of nature—its orchids, sea dragons, and peacock tails—would be far more utilitarian. And that would make the world a drab place.

Malone and Ovenden, “Natureculture,” 2016.
A 27-year-old woman.
A 23-year-old woman from Michigan.
Pansexuality is a more recent term for attraction to all people regardless of gender.
Something close to this idea was also proposed by Anne Hale, Lindsay B. Miller, and Jason Weaver in their paper “The Dual Scales of Sexual Orientation,” 2019.
By contrast, many non-WEIRD societies put greater emphasis on social adaptability, as they value relationships above individuals. Henrich, Heine, and Norenzayan, “The Weirdest People in the World?,” 2010.
The age hypothesis doesn’t imply that individuals of a given age are all the same; they vary, and for an individual, often there will be strong correlations over time. For instance, someone who is tall for their age at 18 will probably still be tall for their age at 80; height is nonetheless a variable that follows the age hypothesis perfectly in the survey data.
“Cheating” is possible. Workers are anonymous and can make up multiple identities, using them to bypass this mechanism. I didn’t find evidence of this occurring any statistically significant number of times, though. Workers on Mechanical Turk generally unlock tasks by acquiring qualifications, reaching milestones, and earning good reputations, which tends to disincent switching identities.
As shown in the Appendix, age itself also follows the age hypothesis, meaning that the age distribution of Mechanical Turk workers is stable from one year to the next.
Yoshino, “Covering,” 2002.
Which isn’t to say that culturally transmitted ideas are always good ones; this book documents many ideas strongly held by experts over the past two centuries that most of us would abhor today.
In reality evolution is much slower, since factors like mutation rate limit how much a generation can differ genetically from the previous one.
The dynamics of human population growth and decline will be explored in much more detail in Part III.
There are still hungry people in the world. However, as the statistics in Chapter 18 will show, the number of people for whom caloric shortfalls limit survival has been falling steeply for many decades, and now represents a relatively small minority. In many places, though—including “food deserts” in otherwise developed countries, like the US—the most readily available calories come from fast food or junk food. Starvation is rare, but diabetes is prevalent.
Blackmore, The Meme Machine, 2000.
Blackmore’s use of the word “meme” long predates internet memes, though they, too, undergo something like an evolutionary process, complete with Margulis-style symbiosis as images are colonized and repurposed by words, or vice versa.
To readers of the future who may be (blessedly) ignorant of this ephemeral craze: in 2017, US Poison Control Centers fielded over ten thousand calls about children chomping on concentrated dishwasher detergent pods, due in part to social media “challenges” encouraging the gullible to eat them. Chokshi, “Yes, People Really Are Eating Tide Pods. No, It’s Not Safe,” 2018.
Octopus eyes evolved independently, and they got it right, with the photoreceptors in front and the rest of the machinery behind. Serb and Eernisse, “Charting Evolution’s Trajectory: Using Molluscan Eye Diversity to Understand Parallel and Convergent Evolution,” 2008.


