


The universal need to connect with others has brought the world online. That same force has been attracting us together in space since long before the internet. It’s human physics. Gravity caused the sparse clouds of hydrogen gas that characterized the early universe to coalesce over time into stars and galaxies; attraction between people does the same. We call the structures that emerge villages, towns, and cities. Just as a collapsing hydrogen cloud ignites at a certain density and begins to burn with nuclear fusion, when human populations condense into cities they, too, begin to glow—with new ideas, traditions, technologies, economies, arts, and culture.
“Ignition” is the overarching story of much of the past 10,000 years or so of human development, and because developing culture and increasing population density create potent feedback loops, urbanization has greatly accelerated in recent history. History itself has in turn accelerated. While the overwhelming majority of us used to gather, hunt, or farm, living in nomadic bands or in small settled communities, in the 2000s we’ve reached a milestone: Today over half of humanity lives in a city.

Urbanization also gives rise to another, subtler feedback loop. We’ve seen that identity, gender, and attraction are partly built into our genetic inheritance, but are also partly cultural, environmental, and volitional. So attraction brings people together, which creates culture and subculture, which in turn alters the way we identify and creates new patterns of attraction.
Cultural innovation also leads to specialization, sorting, and something like speciation; cities act as cultural reactors for the rapid evolution of new practices and norms. 1 That’s why prudes like William Acton (see Chapter 9) tend to express moral panic about “sex in the city,” where seemingly anything goes; their so-called “immoral haunts” are invariably urban bars and clubs, not country barns hosting square dances. The “perverse” is, in effect, the unfamiliar.
The “immoral haunt” trope is a classic. 2 We can watch it retreaded a century later—or, if you’d prefer, a long time ago and in a galaxy far, far away—at the Mos Eisley Cantina on the planet Tatooine in Star Wars (1977). In the movie, Jedi master Obi-Wan Kenobi primly characterizes the Cantina as a “wretched hive of scum and villainy.” On the other hand, this interplanetary urban dive is clearly the place to go for decent music (in real life, a jazz composition by John Williams featuring Afro-Caribbean instruments for added “exoticism”). In the Star Wars novelization, Obi-Wan offers more nuance:
Most of the good, independent freighter pilots frequent this place, though many can afford better. They can talk freely here. […] Watch yourself though. This place can be rough. 3

Walking inside, Luke Skywalker, our wide-eyed country bumpkin, is “astonished at the variety of beings making use of the bar”:
There were one-eyed creatures and thousand-eyed, creatures with scales, creatures with fur, and some with skin that seemed to ripple and change consistency according to their feelings of the moment.
Hovering near the bar itself was a towering insectoid that Luke glimpsed only as a threatening shadow. It contrasted with two of the tallest women Luke had ever seen. They were among the most normal-looking of the outrageous assemblage of humans that mixed freely among alien counterparts. Tentacles, claws, and hands were wrapped around drinking utensils of various sizes and shapes. Conversation was a steady babble of human and alien tongues. 4
.webp "A women whose skin is painted green, wearing green prosthetics, a mesh dress, and a collar, leading her to look like the the Star Wars character Oola.")
Variety, sensuality, food and drink, unfamiliar scents and languages, foreign accents, trade and commerce, music and art, style and fashion—in short, culture. Such complexity emerges from the convergence and density of the city (or “spaceport”), its busy, high-speed cross-pollination. Contrast this state of affairs with the monkish asceticism of the few remaining Jedi, or the bland Midwestern isolation of Luke’s uncle’s farm—cultural environments where small numbers and low density conspire to ensure that nothing much ever changes. Hence, traditional values.
Alfred Kinsey and colleagues noticed the powerful effect of population density in producing a sharp contrast between “sex in the city” and “sex in the countryside.” In their analysis, they sought to disentangle the biological universals of human attraction from the queer particulars of urban life, while dispelling the idea that homosexuality (for instance) is some kind of uniquely urban “disorder”:
There is a wide-spread theory among psychologists and psychiatrists that the homosexual is a product of an effete and over-organized urban civilization. The failure to make heterosexual adjustments is supposed to be consequent on the complexities of life in our modern cities; or it is a product of a neuroticism which the high speed of living in the city imposes upon an increasing number of individuals. The specific data on the particular rural and urban groups […] do seem to suggest that there is something in city life which encourages the development of the homosexual. But the distinctive thing about homosexuality in the city is the development of a more or less organized group activity which is unknown in any rural area.
Large cities have taverns, night clubs, restaurants, and baths which may be frequented almost exclusively by persons interested in meeting homosexual friends […]. In this city group, the development of an elaborate argot gives a sense of belonging which may defend a minority group against the rest of society; but it also intensifies a feeling which the group has that it stands apart from the rest of the population. Moreover, it is this city group which exhibits all the affectations, the mannerisms, the dress and the other displays which the rest of the population take to be distinctive of all homosexual persons, even though it is only a small fraction of the males with homosexual histories who ever display such characteristics. None of these city-bred homosexual institutions is known in rural areas […]. 5

Kinsey’s main observation here was that many mannerisms we think of as “gay” aren’t about being gay in itself, but reflect a particular gay urban culture. A number of survey respondents acknowledge this cultural dimension, and one even points out the feedback effect of culture back onto attraction:
Not only does my sexuality/sexual attraction fluctuate, but culture has a big influence on it. I travel around the world getting paid to have adventures. There are women and men that I meet who I only find attractive within the particular culture. Take the same person and let them assimilate into a different culture and my attraction fades. Somehow the social dynamics make a big difference for me. 6

Of course, the same could be said of “being straight”; heterosexual masculinity, for instance, can manifest in many ways in different cultures, potentially resulting in different patterns of attraction. 7 However, minorities, sexual or otherwise, can only concentrate their numbers to achieve “cultural ignition” in big cities. That’s why gay cultures tend to be urban—whether in ancient Greece, Victorian London, or the East Village in New York—even though, as far as we know, homosexual attraction exists everywhere and has existed in every historical era. 8
How relevant is this urban phenomenon to the United States, though? You might not think of the US as a particularly urban country. Its founding myth featured wide-open spaces, attractive to rugged homesteaders seeking escape from a corrupt, overcrowded, citified Old World. Thus the Skywalker farm evokes the American heartland, while the Mos Eisley cantina (its exterior footage was filmed in Tunisia) reads as dangerous and foreign—literally, alien.
Thomas Jefferson would have shared this anti-urban sensibility; his United States was a land of gentleman-farmers, self-sufficient and incorruptible. Of course there was a certain cognitive dissonance in the Jeffersonian utopia, relying as it did on a steady supply of urban goodies for the library and the drawing room… not to mention plenty of slave labor. Also, let’s not forget that the Americas were far from uninhabited when European colonists first arrived, having supported both nomadic and settled societies for many thousands of years. 9

In more recent memory, the US has often been described as suburban, home to a Flintstones lifestyle of low-slung residential neighborhoods dotted with lawns, backyard barbecues, swing sets, and two-car garages, a short drive from some freeway entrance ramp. Suburban sprawl is real. It mushroomed during the Cold War, partly owing to a massive federally funded plan to make the country harder to wipe out with targeted nuclear strikes on its cities. 10

Mass relocation to the suburbs required a kind of urban erasure in the American imagination. It helped that many Americans had long been suspicious of life in the city, that “wretched hive of scum and villainy”; but the rural alternative was no longer attractive for most, or even viable. As geographic historian Mathew Farish has put it,
[T]he antithesis of the degraded city was the small, independent farm; but by 1950 this image […] was an anachronism, replaced by the high modernist pastoralism of the postwar suburbs—peripheral, expansive and architecturally, racially and (largely) economically homogeneous. It was these suburban ‘citadels’ that infiltrated the discourse of Cold War geopolitics: they were the quintessential sites of American life […]. Suburbs embodied order, safety and a deeply gendered consumerism […]. 11
Farish describes Soviet premier Nikita Khrushchev’s visit to the US in 1959. President Eisenhower took Khrushchev to see Levittown, an ur-suburb completed in 1947 whose builder, William Levitt, had proclaimed that “no man who owns his own house and lot can be a Communist… he has too much to do.”
Or, perhaps, too little to do! For the vaunted safety of the suburbs wasn’t only about staying outside the lethal radius of a hypothetical nuclear strike downtown. According to George Kennan, one of the architects of the US’s Cold War policy of Soviet containment, the groups most susceptible to communist infiltration included “labor unions, youth leagues, women’s organizations, racial societies, religious societies, social organizations, cultural groups, liberal magazines, publishing houses, etc.” 12 All were vectors for social transmission—hence the erosion of traditional values.
Foreigners, artists, latchkey kids, and homosexuals joined communists on the menu of national security concerns. Undercover FBI agents even snuck onto women’s softball teams to keep tabs on the lesbian menace. 13 Hence, the city itself was regarded as an enemy within, and like communism, it, too, needed to be contained. The suburbs were that containment vessel, bland and culturally impenetrable.
So went the rhetoric. But what do the data tell us?
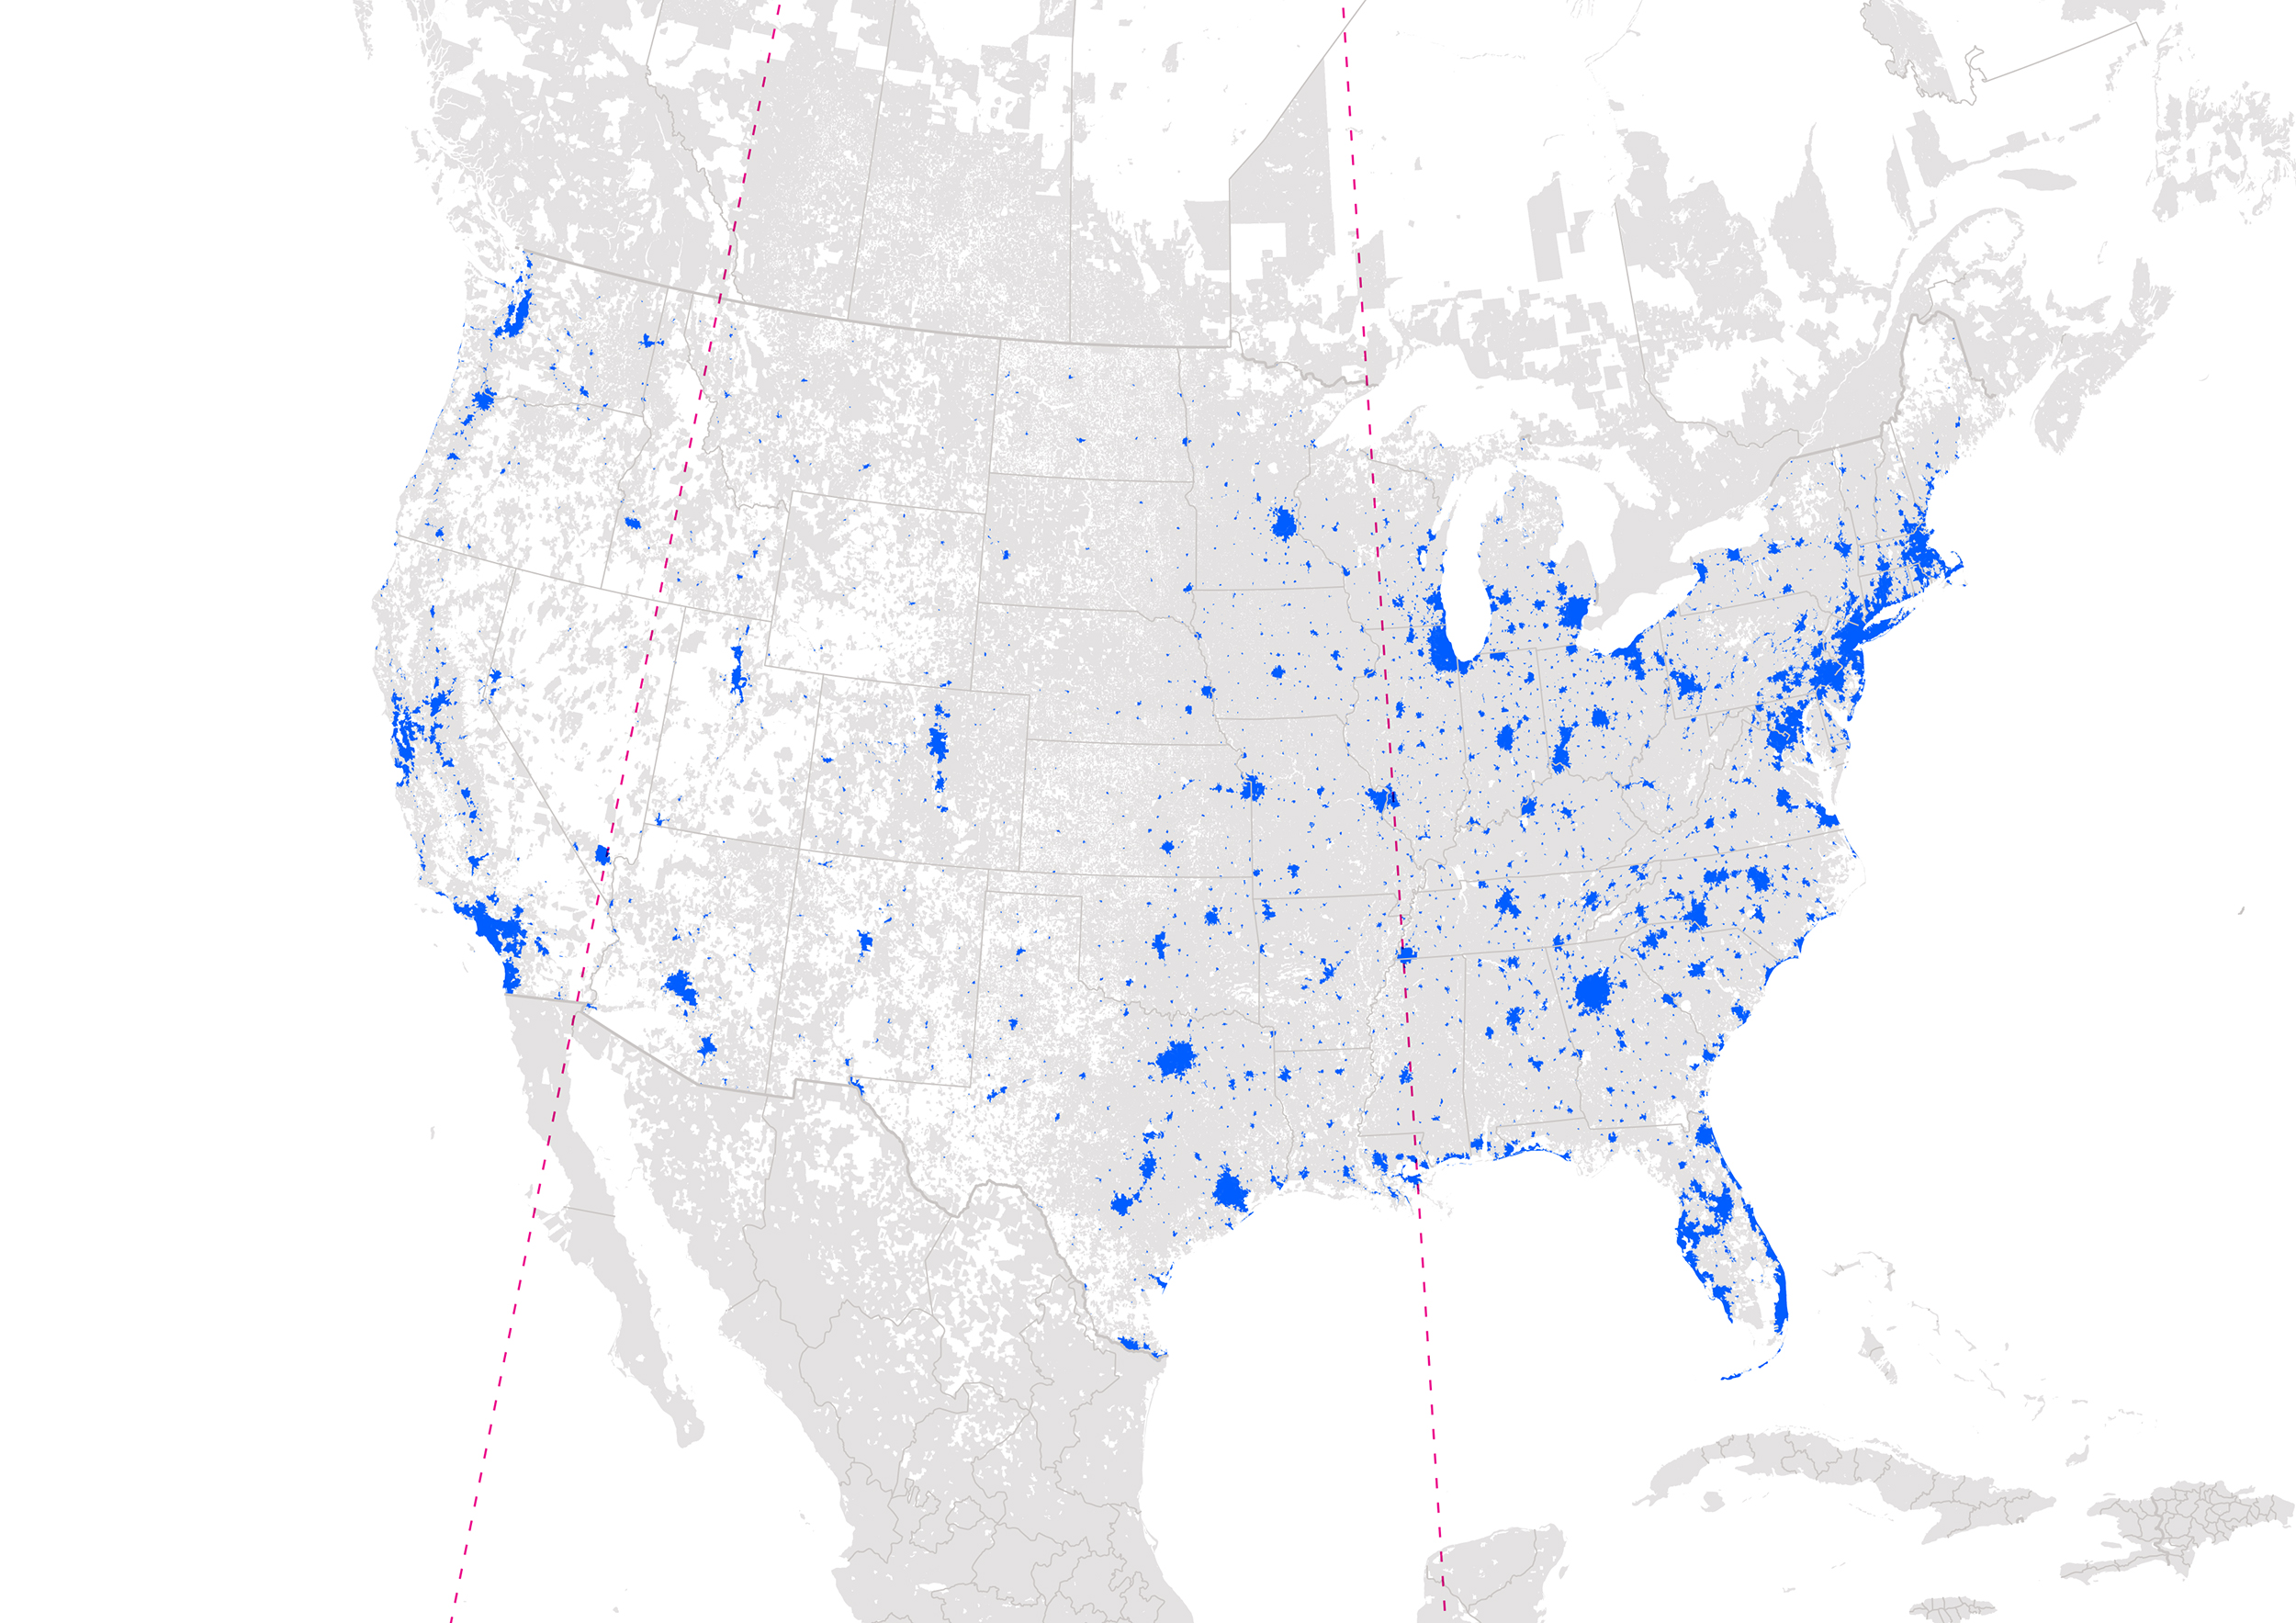
Census Bureau figures show how many people live in every ZIP code, and ZIP codes can be mapped. Technically, the official maps show “ZIP Code Tabulation Areas” (ZCTAs), since ZIP codes were originally designed for mail delivery, and until the year 2000 they didn’t correspond to areas on the map with defined borders. With ZCTAs, though, the ground area of every ZIP code can be calculated, making it possible to create a detailed map of population density. Coloring in the ZIP code areas from densest to sparsest, stopping when 62.7% of the population has been covered, makes the country’s fundamentally urban character obvious.
The headline: by area, only 3.23% of the country is colored in. In other words, an extraordinarily large fraction of the American population lives on a very small percentage of the land. 14
The 62.7% cutoff is arbitrary, but for now, think of the colored-in ZIP codes as “urban,” and the others as “rural”; I’ll soon quantify the excluded middle of this binary—the suburbs. (White areas, mostly representing mountainous and wild terrain where there are no mail delivery routes, have—at least officially—no permanent population.) The resulting density map looks a lot like NASA’s “Black Marble,” the Earth as imaged by satellite at night, since terrestrial light sources and cities generally coincide.
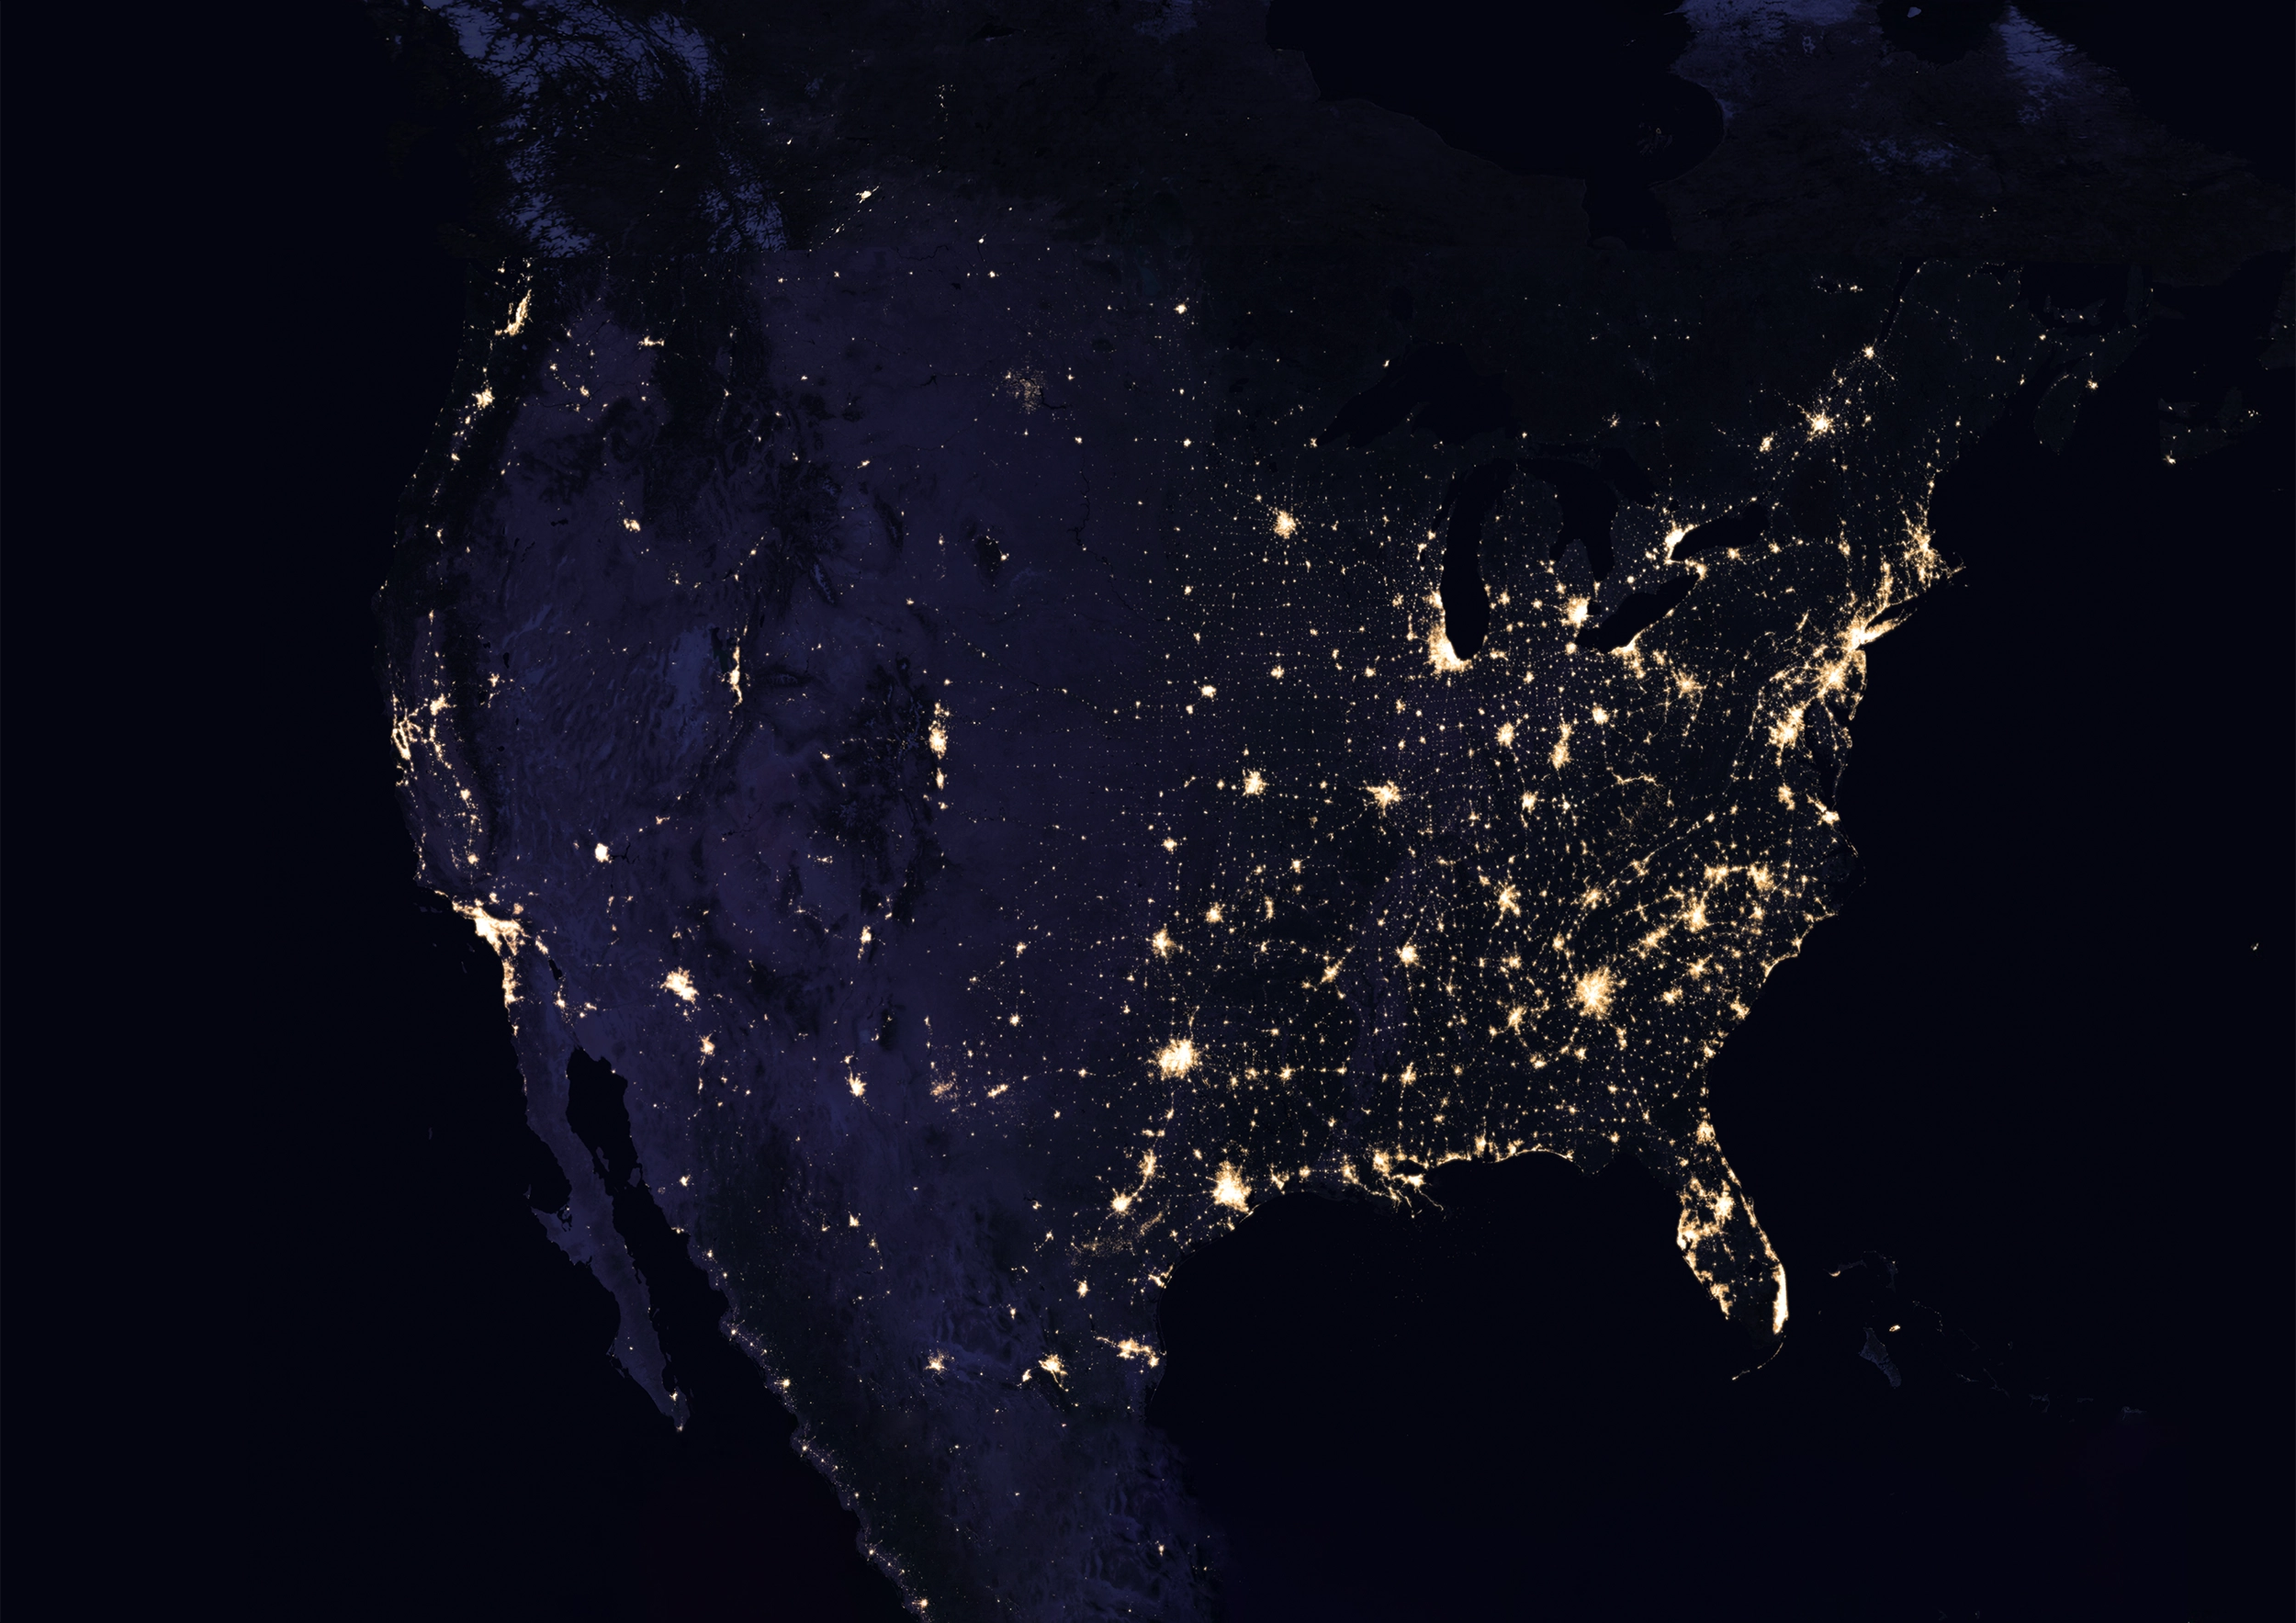
As its name implies, NASA’s Black Marble covers the whole planet. It’s a powerful image, rendering the simile of cities as stars in the night sky almost literal—as above, so below. Civilization radiates light. If we could see this image in time lapse over the past few centuries, we’d indeed witness cities “ignite” as their populations coalesce, first very faintly with firelight, then with gaslight, then much more brightly with electrification. 15
As we’ll explore in this third and final part of the book, the dark regions of the map are critically important too. At risk of belaboring the obvious, the city and the countryside are interdependent. Cities have always relied on a much larger hinterland for food, water, and other natural resources, and on the farmers, miners, woodcutters, wagon or truck drivers, and so on who do essential work needed to keep the city alive, yet don’t live in cities themselves.
On the other hand, the vision of a bucolic countryside that could get by just fine without the city is also a fantasy. Given Jefferson’s beautiful study at Monticello, full of books and gadgets purchased in New York, London, and Paris, and his general obsession with scientific advancement, he probably was well aware of this—in private. We couldn’t farm at today’s scale using anything like the backbreaking techniques of pre-industrial homesteaders (or slave plantations) anymore, or keep livestock in the traditional ways of the Maasai in East Africa. Such techniques have been characterized by the word “subsistence” because they allow agriculturalists or pastoralists to feed themselves, but they don’t produce the superabundance needed to additionally feed an urban population orders of magnitude larger.

Of course that would be fine if there were no cities to feed. However, even the most committed anti-urbanists would agree that the very high infant mortality and low life expectancy of 18th century peasants is a legacy we’re glad to have left behind. Life in the countryside today depends deeply on the technology, goods, expertise, services, and culture that come from the city.
Precisely these technologies and services not only have allowed cities to grow bigger, but have caused the countryside to become far more sparsely populated than it used to be. Today’s gigantic farms rely on intensive mechanization, hence far less human labor, than in the past. High-technology farming explains why so much of the population lives in such a small fraction of the country’s land area today.
Keeping this in mind, it may come as less of a surprise that the United States, with its advanced economy and relatively recent colonial reformatting, is especially urbanized relative to the rest of the world. In fact, one can argue that the US has been the world’s leading economy over the past century or so as a direct result of its urban density and overall scale, not due to some uniquely American character trait. Achieving such scale and density was in turn a product of the timing and manner of American colonial settlement—by the very people who were pioneering the key enabling technologies for large scale urbanization.
Trends over time tell this story clearly. In 1800, around 10% of Europeans lived in cities; in the United States, the figure was under 5%. 16 Farming efficiency only needed to be marginally above subsistence level to support such comparatively small urban populations. Then, the technologies of the Industrial Revolution, first invented in Britain and Europe, began to take root in the US, especially in the northern states, following the abolition of slavery there.
The new country was short on labor, but had plenty of space and natural resources—thanks to (at times genocidal) land seizure on a breathtaking scale. Hence mechanized practices that saved labor, even if they were profligate with energy or raw materials, were more economically viable in the American context than elsewhere. Also, such innovations met little resistance from the artisans and organized workers who had long pushed back against automation in the Old World.
Once introduced, mechanization put businesses on a path toward ever-increasing productivity. Even when first-generation industrial technology proved wasteful, balky, or of questionable quality, it established a baseline. Any subsequent improvements through the investment of intellectual or economic capital increased operating profit; thus, “automation culture” is friendly to the kind of entrepreneurial tinkering and relentless optimization that would come to characterize American industrial capitalism. 17
Applied to agriculture, mechanization greatly scaled up farming efficiency. This drove urbanization so quickly that by 1860, the US and Europe had both risen to 20% urban, with the US, on a steeper upward slope, surging ahead of the rest of the world over the next century. Urbanization marched onward, slowed only momentarily by the Great Depression, 18 until the countryside started to run out of people who could fuel this great migration into cities. Even then, American cities continued to grow thanks to an influx from abroad; with such a dynamic economy, the country had become an attractive destination for immigrants from all over the world. So, by 1920, half of Americans lived in cities; by the 1960s, two out of three; and by the 2000s, four out of five.
The Black Marble shows how west of the Mississippi, later European settlement, which could take advantage of more advanced technologies from the start, resulted in an especially sparse countryside, with the great majority of people there settling into a handful of dense urban pockets. East of the Mississippi, earlier settlement yielded a more typically Old World pattern, full of small and mid-sized towns, but even there (with the exception of a dense corridor from Washington, DC to New York) most of the land is quite sparsely populated—and becoming more so every year.
Plotting the relationship between cumulative population and cumulative land area offers a more complete sense of today’s population distribution. The 100 million people living in the densest places occupy only about 18,000 square miles—equivalent to a square 130 miles on a side, or 0.63% of the total area of the US. Dashed red crosshairs show 62.7% of the US population, a bit under 200 million people; they occupy just 3.23% of the total area. These remarkable statistics highlight an effect that, while obvious, is still worth dwelling on: the growth of cities, driven as it is by migration from the countryside, both implies and creates vast, sparsely inhabited hinterlands.
I asked survey respondents for their ZIP code so that it would be possible to break down their answers not only by age, but also by population density. In addition, the surveys included the seemingly redundant questions, “Do you live in the city?”, “Do you live in the suburbs?”, and “Do you live in the countryside?” Responses to these questions offer us a chance to compare a physical measurement—population density based on ZIP code, which varies continuously—with the subjective labels people use when describing themselves as city, suburb, or countryside dwellers.
The horizontal axis shows ZIP code density, measured in square meters per person. Because this quantity varies over such a vast range, from only about 10 square meters per person in dense cities (where people might be living literally on top of each other in apartment buildings) to more than 100,000 square meters per person (think Montana), a logarithmic axis is needed to make out the curves clearly, meaning the evenly spaced tick marks are 100, 1,000, 10,000, 100,000 rather than 100, 200, 300, 400.
The vertical axis breaks down, at each density, the fraction of people answering “yes” to precisely one of the questions “Do you live in the city?”, “Do you live in the suburbs?”, and “Do you live in the countryside?” A cumulative percentage of the total US population as a function of density is also shown, as in the previous plot, in black. Keep in mind that without a logarithmic horizontal axis, most of the area shown would be countryside; recall that the entire half of the plot to the left of the dotted red crosshairs, again representing about 62.7% of the population, covers only 3.23% of the country’s area, while the right half covers the remaining 96.77%. As you can see, the 62.7% population threshold evenly splits the suburbs into a more urban half and a more rural half.
Now, we have an objective answer to the subjective question of what the terms “city,” “suburb,” and “countryside” actually mean to people. Unsurprisingly, this objective answer doesn’t feature sharp thresholds in terms of population density (or, it seems safe to assume, in terms of any other measurable quantity). One could choose to define such thresholds by popular vote (e.g., cities as places with less than about 1,000 square meters per person, suburbs between about 1,000 and about 10,000, and countryside above 10,000), but those cutoffs are just the densities at which disagreement between people is at its highest.
As in every other situation where you might suppose answers to be mutually exclusive, some people respond to the three yes/no questions ambiguously. It’s just like handedness and sexual orientation. People who answer “no” to all, or “yes” to more than one of the three, probably have a story as to why that makes sense for them, as with a woman from San Clemente, California, who wrote, “I’m not certain if I live in a suburb or a city. I believe I’m on the edge of both.”
So once again, we have excluded middles. And once again, we could wonder whether some kind of objective right answer might exist, perhaps based on an official city map. But even here, ground truth is elusive. Many maps of cities have boundaries drawn on them in one place or another, and some of those boundaries matter, determining who your state representative is, or whether you have to pay a city tax. To people living on those borders, though, they often feel arbitrary. And, in fact, they change all the time, as cities grow (and, sometimes, shrink). Those who redraw borders tend to acknowledge that the new border better reflects “reality.”
When they do so, they acknowledge that city boundaries are socially constructed. This doesn’t imply that there are no such boundaries, or that they’re an illusion, or that they don’t correlate with any underlying physical property—obviously they do, as NASA’s Black Marble makes clear. For them to be socially constructed means that they’re a necessarily imperfect, somewhat fuzzy, and ever-shifting consensus arising from both direct observation and continual tugs in different directions—politics, in other words.
Inevitably, feedback loops arise. For instance, at some point, an official map might be drawn based on some person or committee’s opinion or political interest. If the map actually matters (say, because of differing tax rates or zoning codes), then that map will shape how future development occurs. Development affects local population density. Local density affects people’s mental models as to where the city ends. Those models in turn affect what subsequent officials think, and how they amend future maps. People also affect each other’s mental models all the time, through their everyday use of language, and sometimes through arguments about definitions, either with regard to specific instances (your house isn’t really in the city!) or general principles (if you live in a high rise apartment it must be part of the city!).
I live in a city that could be classified as the suburbs, but city officials are trying to get away from that term so I consider where I live Urban. 19

So, the push and pull of opinions will affect physical reality, and reality will affect opinions. Those feedback loops can work to bring people into greater agreement, but they can also—and even simultaneously—create opposing camps, sharpen disagreements, and foster tribalism.
By now, these themes will all sound familiar. Our reality is both grounded in the observable world and deeply social; further, our beliefs shape our present and future reality. Or, perhaps more accurately, “realities,” since outside the realm of pure math, reality can’t be fully pinned down or seen from an entirely objective point of view. It’s fuzzy and plural. And “measuring” it tends to affect it, a bit like quantum physics.
I carried out a fun experiment with the data to illustrate how the definitions of words like “city” and “countryside” vary socially. As Black Marble shows, the coasts of the continental US are particularly dense. Segregating ZIP codes by longitude shows how the term “city” is defined differently for people on the coasts as opposed to the heartland. I arbitrarily defined the “Central USA” as ZIP codes that lie between 90°W and 115°W, and “Coastal USA” as ZIP codes lying outside this band. (Those lines of longitude are marked on the population density map.)
On the coasts, the population density has to be a good deal higher, on average, for people to consider themselves city dwellers! If you were to slide one curve over to match the other, you’d find that the difference amounts to more than a threefold change in density. That is, on the coasts, the land area per person has to be one third of what it would have to be in the central US before an “average” person would consider themselves to be a city dweller. The same pattern holds for suburbs and for the countryside (also, there are fewer suburbanites overall in the central US, which makes sense, since the cities tend to be smaller).
If the meanings of “city” and “countryside” change from the coast to the heartland, it’s easy to imagine that will be even truer of more contested terms like “trans” and “queer.” To reiterate a point I’ve made in Parts I and II, this book doesn’t argue for the correctness of any particular definition; I agree with gender and technology researcher Os Keyes, who has written:
What does it mean to say someone is queer? What does it mean to say someone is trans? In both cases, there really isn’t a fixed definition that holds everywhere. Trans identity is contextual, and fluid; it is also autonomous. There’s no test that you give someone to determine they’re “actually” trans […]. 20
One 33-year-old survey respondent from San Francisco offered a definition of “queer” expansive enough to accommodate nearly anybody:
“Queer” simply means “different,” I have always been different, I’ve always loved being different, I mesh well with my fellow, harmless, polite, outcasts of the world, proudly. Also, San Francisco.

One might guess that a more conservative respondent—perhaps from one of the squarer states between the coasts—would define “queer” differently.
Rather than comparing the center to the coasts, in this chapter and the next, I’ll break down survey responses by density itself, contrasting “city people,” defined as those who both say that they live in the city and are in ZIP codes corresponding to the densest 62.7% of the American population, with “country people,” who both say they live in the countryside and are in ZIP codes corresponding to the sparsest 37.3%.
As usual, the distinction is both arbitrary and noisy around the edges. It also excludes some respondents. However, it does a reasonable job of highlighting meaningful differences between urban and rural populations. I’ll argue that these differences are both the natural result of the “population physics” sketched at the beginning of this chapter, and the key drivers of the political polarization that characterizes our time.
In the popular imagination, that polarization has often been framed geographically, in terms of “coastal elites” versus “flyover country,” but this view isn’t accurate. The coasts are of course more “citified” on average, and the heartland more “countrified,” but in today’s geography of ideas, Manhattan is much closer to Chicago, Houston, or Los Angeles than to upstate New York.
So, how does this play out for queerness? First: fewer queer people live in the countryside than in the city. The gap is insignificant among young people, about 15% of whom are queer regardless of where they live; but by age 65, nearly threefold more city-dwellers identify as queer: one in twenty in the city, and one in fifty in the country. (Keep in mind that curves swooping downward nearly in parallel may be maintaining a roughly constant difference in absolute terms, but in relative terms, their difference becomes far more meaningful at lower percentages.)
In part, the greater percentage of heteronormatively attracted people 21 in the countryside explains the lower percentage of queer people living there. Once again, young people are similar, but there’s a marked divergence with age. There’s more to this story, though.
The definition of queerness also appears to vary between these populations in interesting ways. In the countryside, a large majority of older gay and lesbian people—perhaps 90%—consider themselves queer, while this is true of less than half of urban 70-year-old gay and lesbian people. This gap illustrates the way older people in the countryside tend to use terms like “queer” in a manner more consistent with its older mid-20th century usage—which, remember, wasn’t just “different,” but tended to mean specifically gay or lesbian. Hence, both self-reported attraction and the use of identity language are more traditional in the countryside, especially among older people.
It would be exhausting to reproduce all of the plots in Part II in their city/countryside versions, so let’s stick to a few representative highlights, illustrating the following broad observations:
The countryside is more conservative.
Young people in the city and countryside differ less, while older people differ more.
Hence older people in the countryside tend to be extra-conservative.
Non-monogamy and polyamory, for instance, are far more common in the city, again showing modest differences among the young, but an increasing divergence with age.
Non-monogamy looks similar for city and countryside dwellers in their 20s, but in the city, it increases with age, while in the countryside, it decreases a bit with age, until by age 65 the city rate is double the countryside rate. Recall from Chapter 5 that the pattern of overall increase with age probably stems from people in long-term relationships eventually seeking additional sexual or romantic outlets. In the city, such opportunities are more plentiful, and perhaps pursuing them is also less stigmatized.
Similar patterns show up in the lesbian, gay, and bi populations. As with the other trends, the pattern probably owes to several effects: first, young people live online more, which does a lot to erase the geographic distinctions between city and countryside; but also, young people are likelier to live where they were born. As we get older, we often move, especially in the US. This results in a geographic sorting of the population, an effect we’ll return to.
Finally, insofar as people have some degree of flexibility with respect to their gender or sexuality (or any other aspect of their behavior and identity), they’ll be biased by their environment. Social transmission is just as likely to suppress a latent minority orientation or identity in the countryside as to amplify it in the city.
It’s hard to overstate the divergent results of these effects on people’s mental models of what is “normal.” For instance, over 10% of young people identify as “Homosexual, gay or lesbian,” but among older people in the countryside, the number drops below 2%; for the earliest data from 2018, the figure is closer to 1%. A minority trait shared by one in ten people feels very different, psychologically, from one you believe to hold for only one in a hundred.
As described in Chapter 13, the number of young people assigned female at birth identifying as trans is rising dramatically. Being young, being assigned female at birth, responding to the most recent survey (2021), and (it turns out) living in the city all increase the odds, to the point where about 14% of 18- to 21-year-olds satisfying these criteria identify as trans. Both the difference between the city and the countryside and the sharp rise from 2018 to 2021 suggest that social transmission is a significant factor.
Unlike the usual trend toward greater frequency of minority identification among the young, remember that non-binary identity exhibits an unusual, U-shaped age pattern (see Chapter 10). Exploring its origin led us to an investigation of intersexuality and the recent reversal in intersex medical protocols. Breaking the non-binary curve down by urban vs. rural populations adds more color to this story.
As you might expect, more non-binary people live in the city than in the countryside—at almost all ages, though the relative difference is negligible at the younger end of the scale. Among the older cohort in the countryside, however, there’s an even sharper upward turn than in the city; the error bars are large, but it might be that even more 73-year-olds in the countryside identify as non-binary than city-dwellers—perhaps over 8%!
Recall that one likely driver of this rise in non-binariness late in life is the large cohort of intersex people who used to be arbitrarily assigned male at birth. Looking at intersex statistics may help clarify what’s going on.
Although, once again, the error bars are large, these data are consistent with the broader idea that changes in culture and practices begin in the city, then propagate over time to the countryside. Most noticeably, self-reported intersexuality is much more prevalent in the city than in the countryside, over all ages and regardless of sex assigned at birth. We can probably assume that the underlying rate of intersexuality isn’t different—but the rate of diagnosis is.
As the physician and sexologist David Oliver Cauldwell pointed out as far back as 1948 (albeit using language that is no longer current),
The hermaphrodite is not always easy to recognize. The positive hermaphrodite condition of a large number of individuals has not been determined until after the death of the individual. Diagnoses have been made, however, through deliberate biopsy, and through accidental discovery upon the initiation of surgical procedures for other reasons. 22
What was true in 1948 remains true today, especially among populations with less access to medical care or to intersex and trans communities—which is to say, outside the city. Even when they recognize an intersex birth, many more doctors in the countryside still might be following John Money’s advice to keep that person (and perhaps even their parents) in the dark.
The shift toward assigning more intersex babies female at birth also seems to have taken place earlier and more decisively in the city. 23
Assuming that the city numbers are more accurate, this should also cause us to revise our estimate of the “real” rate of intersexuality (with the caveat that “reality” here is hard to define) upward yet again, to at least 4% of those assigned female at birth! All of those unacknowledged intersex people—as well as trans and gender-expansive people—are likely contributors to the outsized increase in non-binariness among older people in the countryside, as with a 35-year-old from Walla Walla, Washington, who wrote, “I’ve wondered if I’m intersex or closet trans.” Even to be able to formulate that question, and potentially have a conversation about it with a doctor, implies an awareness of these traits that older people, especially in the countryside, are less likely to possess.
In the broadest strokes, all of these patterns can be summarized as follows: older people, especially in the countryside, are living in the past. Or, as cyberpunk author William Gibson memorably observed, the future is already here—it’s just not very evenly distributed. 24

This, too, has a physics analog: as collapsing hydrogen clouds begin fusing in the crush of a star’s heart, they begin to form the whole alphabet soup of elements in the periodic table—each with its own patterns of attraction, repulsion, and reactivity.
Historical echoes of it go back at least to ancient Rome.
George Lucas (ghostwritten by Alan Dean Foster), Star Wars: From the Adventures of Luke Skywalker, 93, 1976. Given Alan Dean Foster is a lifelong travel enthusiast with, perhaps, a more cosmopolitan outlook than George Lucas, it’s tempting to interpret Foster’s markedly different tone in the novelization as a small act of subversion.
Lucas, 94.
Kinsey, Pomeroy, and Martin, Sexual Behavior in the Human Male, 455, 1948.
A 38-year-old man from Pearisburg, VA.
Per historian Cynthia Enloe: “Feminists have shown […] that ideas about what constitutes acceptable behavior by men can […] vary in surprising ways across cultures. […] In fact, tourists, traveling executives, overseas troops, aid technocrats, migrant workers—everyone who moves between cultures watches for signs of what constitute appropriate ways to be manly in different societies. Sometimes men try to mimic those forms of masculinity; at other times they view the alternatives with contempt and go home with a renewed sense of the superiority of their own home-grown formulas for being ‘real men.’” The Morning After: Sexual Politics at the End of the Cold War, 5, 1993.
See Brakefield et al., “Same-Sex Sexual Attraction Does Not Spread in Adolescent Social Networks,” 2014. “[P]eer influence has little or no effect on the tendency toward heterosexual or homosexual attraction in teens, and […] sexual orientation is not transmitted via social networks.”
There’s evidence of human habitation in the Americas going back at least to the last glacial maximum. By the 13th century, Cahokia, a settlement of the now lost Mississippian culture, may have had a population larger than that of contemporary London.
Lapp, Must We Hide?, 1949; Lapp, “The Strategy of Civil Defense,” 1950. See also Farish, “Disaster and Decentralization: American Cities and the Cold War,” 2003; Kargon and Molella, “The City as Communications Net: Norbert Wiener, the Atomic Bomb, and Urban Dispersal,” 2004.
Farish, “Disaster and Decentralization: American Cities and the Cold War,” 2003.
Kennan, “The Long Telegram,” 1946.
Enloe, The Morning After: Sexual Politics at the End of the Cold War, 1993.
I originally picked 62.7% to corroborate the headline of a 2015 press release from the US Census Bureau, “U.S. Cities Are Home to 62.7 Percent of the U.S. Population, but Comprise Just 3.5 Percent of Land Area,” 2015. My calculation, based on more recent data, suggests that urbanization is still advancing.
Excessively so, as much of this energy expenditure is wasteful light pollution.
Our World in Data, “Urbanization over the Past 500 Years,” 2018.
Habakkuk, American and British Technology in the Nineteenth Century: The Search for Labour-Saving Inventions, 1962.
Notice how the Great Depression in the US (1929–1939) parallels a similar temporary slowdown in urbanization during the even more devastating “Great Leap Forward” in China (1958–1962), which, ironically, sought to transform the country from an agrarian economy into a technologically advanced communist society. In reality, the technological base for shifting away from an agrarian economy was already developing in China, and attempting to speed up the transformation through wishful thinking and mandated social upheaval appears to have slowed things down instead, in the process causing the death by famine of tens of millions.
A 19-year-old man from Arlington, Texas.
Keyes, “Counting the Countless,” 2019.
As defined earlier: women sexually and romantically attracted exclusively to men, and vice versa.
Cauldwell, Bisexuality in Patterns of Human Behavior: A Study of Individuals Who Indulge in Both Hetero-Sexual and Homosexual Practices, with Comparative Data on Hermaphrodites, the Human Intersex, 6, 1948.
As noted in Chapter 13, intersexuality contributes significantly to the trans population, but doesn’t seem sufficient to account for the sharp rise in trans identification among the young.
O’Toole, “The Future Has Arrived —It’s Just Not Evenly Distributed Yet,” 2012.