How many of us are committed to the traditional Nuclear Family today, and how is this changing? A first clue can be gleaned from the family’s most traditional “output”: the number of children we’re having. 1
When graphed as a function of age, number of children gradually rises, as one would expect, from near zero as a young adult to a plateau around menopause, at age 45 or so. The solid line is the average, the dashed line is the median, and the four concentric shaded regions, from narrowest to widest, enclose 38.3%, 68.2%, 95.4%, and 99.7% of the answers at every age (the 99.7% range goes off the chart, and is noisy, but plateaus somewhere between 8 and 12 children). 2 Zooming in on the inner 38.3% shaded region makes the graph easier to read. It’s also helpful to break the data down by the respondent’s sex assigned at birth, since the people actually giving birth to those children must have uteruses. 3
Notice how women report having significantly more children than men, at all ages. On the face of it, this seems impossible, since every child must have a biological mother and father… right?
Our lived reality is a little different. When a mother gives birth, she knows she’s had a child, and with rare exceptions, she can be certain that the baby is hers. 4 That’s never been true of men. If anything, their answers to the question graphed—“How many children do you have?”—will overestimate the number they believe to be their biological children, while the question for potential mothers—“How many children have you personally given birth to?”—leaves no room for ambiguity with respect to children by marriage or adoption. Men may have one-night stands with unexpected consequences, or split up with their partners soon after conception, or commit rape without using a condom. Or they may donate anonymously to a sperm bank, allowing a single mother somewhere to conceive.
Centers for Disease Control (CDC) data 5 show that about 40% of births in the US happen outside marriage, but this persistent gap reveals something more interesting: that a significant number of births don’t involve the biological father at all. So, many men have children they don’t know about! This might come as a surprise, but there’s no reason to believe it’s a new phenomenon. Nor is the finding specific to any one demographic (I checked).
Setting aside men’s undercounting of their offspring, 1.7 or so children per woman, today’s plateau at menopause, still implies a rapidly shrinking population. With a moment’s thought, you can see how, assuming equal numbers of females and males (and zero childhood deaths), women would need to have two children on average for the next generation to be of the same size. An average lower than two leads to an exponential decline in population over time, a phenomenon we’ll explore in more detail in Part III.
So children are in decline. What about marriage?
While it remains a mainstream institution, the historical notion 6 that marriage is “normal,” and that unmarried middle-aged adults are unusual, is negated by the data. “Peak marriage” for women—which is around age 42—is still just 60% or so. It only crosses 50% to become a majority in the mid-30s.
Evidently, young men tend to marry a few years later than young women, reflecting the traditional small age gap between an older husband and younger wife (about 2.2 years on average, in the US). 7 This age gap becomes larger for people marrying later in life, though, consistent with the folk adage that “a wife should be half the age of her husband with seven years added” 8 —likely part of a larger patriarchal pattern.
Combined with women’s longer life expectancy, the age gap results in a dramatic divergence in marriage among the older population. Only about 20% of 80-year-old women are married; and by their mid-’80s, nearly half are widows. While older surviving men are scarcer (hence the larger error bars), a steadily increasing proportion are married, perhaps precisely because being married increases their odds of survival to an advanced age! Older men aren’t always so great at taking care of themselves. 9
Why do women live longer than men? This still isn’t perfectly understood, but researchers have some theories. Unlike the Y chromosome, which we can live without, the X chromosome carries critical genes. Men generally have only one copy, while women generally have two; this redundancy may confer health benefits. Men’s and women’s immune systems differ too, which could play a role. 10 You might also remember, from way back in Chapter 1, that men are more accident prone than women—maybe at least partly due to testosterone-linked risk-taking behavior.
However, the best explanation may not be mechanistic, but evolutionary: grandmothers are more useful than grandfathers, as far as Darwinian selection is concerned. This may seem counterintuitive, given that women stop being fertile in middle age, while men can continue to have offspring until late in life (though their fertility does decline). However, as discussed in Chapter 4, humans alloparent; it takes a village to raise a baby. In most traditional societies, grandmothers, far more than grandfathers, play a key role in raising their grandchildren—so much so that, in traditional societies, the presence of a grandmother raises a child’s odds of survival substantially. 11
Menopause may even be an evolutionary “innovation” to avoid resource competition between the offspring of successive generations: once she’s done having her own babies, grandma can dedicate her undivided effort to the grandkids. So, since grandchildren also carry grandma’s genes, evolutionary selection will keep pressure on genes that bestow long life on women.
Because older men are less helpful in raising grandchildren, they don’t benefit from the same degree of evolutionary selection pressure; therefore, over many generations, mutations leading to earlier death specifically in men will pile up unchecked. 12 The proximal cause may be anything—heart failure, stroke, cancer, poor judgment, even suicide. The underlying cause is nature’s relative indifference to men’s lifespan beyond their most reproductive years. In fact, it’s conceivable that the same evolutionary force that has prolonged women’s lifespans has actively worked to shorten men’s—since grandma will have more time to devote to the grandkids if she doesn’t have to take care of frail old grandpa too.
But let’s return to marriage.
Breaking down the marriage data based on responses to other survey questions shows that many minority identities and behaviors—such as not being heterosexual, being non-monogamous, or using “they” pronouns—are associated with significantly lower odds of marriage, across all ages. Marriage, in other words, is a traditional practice, and often goes along with being traditional in other ways. As traditions are upended, fewer people are getting married.
So was Morning Glory right about the looming breakdown of the Nuclear Family, and the rise of polyamory? Three questions on the survey bear on this directly: “Are you monogamous?” “Are you non-monogamous?” and “Are you polyamorous?” These terms weren’t familiar to every respondent, especially “polyamorous,” which should be unsurprising, since it was so recently coined by a Neopagan witch to describe a practice that was (at least in 1990) far outside the mainstream.
Remarkably, three decades later, around 5% of American respondents, or 1 in 20, self-identify as polyamorous, across a wide range of ages. 13 That’s about as common as naturally blond hair! It’s also notable that so many more people answer “no” to “Are you monogamous?” than answer “yes” to “Are you non-monogamous?”—a thread we’ll pick up shortly. But first, polyamory.
The need for a term to acknowledge loving and honest sexual relationships among more than two people clearly predated 1990; Thomas and Mary Nichols were writing about such relationships in 1854, and they in turn could point to far older precedents. On the other hand, having newly minted language for the idea clearly has aided its recent rise in popularity—which has in turn triggered some of the same kind of conservative backlash that has accompanied rising acceptance of other sexual minorities. A frustrated 32-year-old man from Boise, Idaho, wrote, “If i went with the gays and polynomous and the non-monagoumas, and homosexual route, I’d might be more accepted into society.”
The association between non-monogamy and homosexuality is not entirely off-base, as a number of relationship models and practices that are now becoming increasingly mainstream were either pioneered by or accepted earlier in gay communities. A 25-year-old from Elizabeth, Colorado, wrote about this aspect of gay culture:
I think a lot of times sexual behavior depends in part on the “culture” of the group of individuals that you fit into, if that makes sense. For example, I find it extremely common among heterosexual individuals [to] just end up having monogamous relationships with the expectation to be together for the rest of their lives (it may be that they both feel that way, or just one feels that way and the other ends up either accepting it and living monogamously or if not then engaging in sexual activities with others without their “partner’s” knowledge). I have found that, at least in the gay male culture, it is much, much more common for individuals to have non-monogamous relationship[s] and to speak freely about all of those relationships with all their partners.
Large age differences, kink, friends with benefits, sex parties, roleplay, safewords, pride parades, and many other practices were also once strongly associated with gay culture, but have now become less so. As these practices have diffused throughout society, though, they haven’t entirely shed the connection with their origins. A sense that gay people were the original cool kids (even if they’re still, in some settings, stigmatized) may help explain the recent strain of self-pitying straight resentment, the sense of being left behind—or of digging in heels and refusing to budge.
Quite a few more people answer “yes” to “non-monogamous” than to “polyamorous,” which makes sense, since non-monogamy is generally understood to be a broader category than polyamory—including, for instance, simultaneous but compartmentalized relationships, swinging, cheating, and “don’t ask, don’t tell” arrangements. In this vein, a cheerful 38-year-old woman from Wisconsin wrote, “I live in a rural area, I am not polyamorous but my husband and I have threesomes together with other women because I enjoy women as well sexually. It is a perk for both of us!”
The age patterns are revealing here. At age 18, non-monogamy begins just above polyamory, at around 6%, but rises steadily with age to nearly 10%, more than double the rate of polyamory, which declines slightly to just below 4%. One likely contribution: a fair number of initially monogamous people become non-monogamous over time, as it becomes clear to them that their needs or wants can’t be met by a single partner. Somewhere between a third and a half of marriages in the US end in divorce, 14 and marriages often represent the more committed end of monogamy, suggesting that a great many people realize at some point that their needs can’t be met by their current partner.
Esther Perel, Dan Savage, and a number of other relationship experts whose work has brought them into contact with struggling couples have pointed out the obvious but often unacknowledged conflict between societal expectations of monogamy (accompanying the stigma of non-monogamy) and the lived realities of many people’s needs and desires. 15 As Michael Ryan pointed out in 1837, “polygamy is interdicted by our laws, [but] it does not exist the less in the hearts of most men who profess to be monogamous, but who are no less polygamous by their actions.” 16 Contrary to Ryan’s belief, this is just as true of women. Speaking for many, a 27-year-old from Canoga Park, California, put it succinctly: “Hard to remain monogamous.”

Although non-monogamy is somewhat less common among the young, a far greater proportion of those who are non-monogamous appear to identify with the honest, consensual, and emotionally committed polyamorous approach espoused by Morning Glory. As a 26-year-old woman from New Orleans, Louisiana put it, “I considered ‘non-monogamous’ and ‘polyamorous’ to be so close they were interchangeable so I gave the same answer.” (In her case, that answer was “yes.”)
This becomes less true of older people, though. Hence, while 70–80% of polyamorous people of all ages report being non-monogamous, the fraction of non-monogamous people who are polyamorous declines from around 50% among young people to under 30% among 65-year-olds.
Given that the stigma associated with non-monogamy appears to be higher among older people, one likely factor is the unwillingness or inability of many older couples to be transparent with each other about their needs. Of course satisfying those needs can lead to non-consensual non-monogamy (read: affairs), but not satisfying them may imply a potential or desire on the part of one partner that the other will never know, as for the 31-year-old woman from Jacksonville, North Carolina, who wrote, “While I am married, and we are monogamous, I am open to being in a triad, but only with another man. I wouldn’t admit this to my husband though.” Obviously such an admission can be frightening, and can have very real negative consequences. On the other hand, it’s hard not to wonder how many couples could be having a better time (“It is a perk for both of us!”) if they overcame their reticence to communicate. Such openness would be easier, too, if the risks and social stigma associated with sex outside marriage were lower, especially for women. 17
Breaking down polyamory and non-monogamy by gender reveals an obvious asymmetry, becoming increasingly pronounced as respondents get older. At age 19, polyamory and non-monogamy are about 4% and 6% respectively, with no difference by gender, but by age 65, both curves show men answering “yes” nearly three times as often as women. For polyamory, the gap grows because the number of men saying “yes” remains constant, while the number of women saying “yes” declines steadily. For non-monogamy, the gap grows because the number of women saying “yes” remains constant(ish), while the number of men climbs all the way up to 14%. What to make of this?
Part of the story might be an old, patriarchal pattern. Recall from Chapter 4 how many traditional agricultural societies practiced polygyny; in such societies, a man’s social status correlates with his number of wives. Historical records offer some extreme examples, like Ismail al Sharif, a Sultan of Morocco from 1672 to 1727, whose harem numbered over 500 women, and Aztec ruler Montezuma II, who reportedly kept four thousand concubines. In the sixth century, King Tamba of Banaras (more commonly known today as Varanasi, in northern India) is believed to have presided over a harem of sixteen thousand women. The very large number of descendants fathered by such men can leave genetic traces on whole populations, especially in the Y chromosome, which passes from father to son. Such traces are known in the literature as “Star Clusters.” 18 In all of these cases, as the man acquires wealth and power—and ages—he also “acquires” consorts, who are typically younger… and younger. (Though it should be noted that in many traditional societies, polygyny involves higher-status men not so much maintaining harems as providing alimony to a succession of ex-partners.) Among very wealthy American men today, a similar pattern still seems to hold: the wives of men on the Forbes 400 list are younger than average, and when they remarry, their new wives are far younger than average. There’s no equivalent pattern for Forbes 400 women. 19
If this is also true (to a more modest degree) among more ordinary people, we’d expect the result to look as it does—a gendered “non-monogamy gap” that increases with age—especially since men die younger than women do. It’s possible that such patriarchal patterns are in decline among young people. It’s also possible that men are simply more willing to acknowledge their non-monogamy because in a patriarchal setting it may confer higher status (“conquests”), while for many women, having multiple partners remains a source of shame. 20
Regardless of gender, older non-monogamous people may also be less eager to identify as polyamorous. That is, it’s likely that a greater number of older people whose approach to non-monogamy is de facto polyamorous just don’t relate to what they may, with some historical justification, consider trendy or New-Agey jargon. No matter how they go about it, it’s certainly the case that older people tend to be more closeted about their non-monogamy, making it a hidden (thus underestimated) minority. Their non-monogamous behavior may be opaque not only to colleagues and friends, but even to their own partners. 21
Polyamory, on the other hand, is for many not just a practice, but a community, a language, and a culture openly acknowledging and supporting the practice. Hence the 20–30% or so of people of all ages who report being polyamorous but not non-monogamous often appear to be identifying with the community or movement, even if that’s not reflected in their current behavior. As a 31-year-old from Woburn, Massachusetts, put it,
My partner and I are both exploring the idea of polyamory but have been thus far monogamous in our relationship. I Identify as poly in that I do not experience jealousy and am interested in having multiple romantic and sexual partners, but have not yet had a “polyamorous relationship.”
This can all be quite confusing. Naïvely following the logic of double negatives, the finding that about 6% of young people are non-monogamous would lead one to conclude that 94% are monogamous… but that would be wrong. Only about 70% of 19-year-olds report being monogamous. This number rises above 85% by age 65.
| 18–20 years old | No to monogamous | Yes to monogamous |
|---|---|---|
| No to non-monogamous | 23.13% | 71.04% |
| Yes to non-monogamous | 5.03% | 0.79% |
| 50+ years old | No to monogamous | Yes to monogamous |
|---|---|---|
| No to non-monogamous | 7.83% | 82.72% |
| Yes to non-monogamous | 6.94% | 2.51% |
Let’s explore the counterintuitive difference between “being non-monogamous” and “not being monogamous.” Consider all four possibilities: (A) those who answer “no” to both “monogamous” and “non-monogamous,” (B) those who answer “yes” to “monogamous” but “no” to “non-monogamous,” (C) those who answer “no” to “monogamous” but “yes” to “non-monogamous,” and (D) those who answer “yes” to both.
The majority at all ages, despite the moral panic of a certain frustrated “monagoumas” respondent from Boise, is still the conventional (B) “yes” to “monogamous” and “no” to “non-monogamous”; for the most part, these are people in monogamous, pair-bonded relationships.
Since these are the only four possible responses to two yes/no questions—hence options (A), (B), (C), and (D) add up to 100%—the whole picture can be gleaned from the three minority combinations, (A), (C), and (D). The second most frequent response is (A), “no” to “monogamous” and “no” to “non-monogamous,” as typified by a 41-year-old respondent from Elk Grove Village, Illinois: “I’m faithful to who I’m with at the time, but I’m not with anyone now. So I answered no to both.” As one might expect, this number declines with age, from near 25% at 19 to only about 7% by age 65, as more people end up partnered over time.
Over the same period, the number of (C) “not monogamous” and “non-monogamous” people rises from 5% to 7%, in keeping with what we’ve already seen. Notice that the largely unpartnered group (A) and the multiply partnered group (C) end up tied by age 65, despite (A) being five times likelier at age 19.
The lowest likelihood combination—(D) “yes” to both questions—is the most counterintuitive. It can arise from varying interpretations of the two terms, as in the case of a 26-year-old woman from Ormond Beach, Florida: “I am currently monogamous, but there have been times I have been with women that my husband is aware of. If it were to present itself, I would be sexual with another woman and or have a love triangle poly relationship.” In other words, this is a situation in which one of the terms—“monogamous”—is interpreted as a behavior that applies in the moment, while “non-monogamous” is interpreted as an identity or orientation, which may not be reflected in one’s current behavior.
There’s a parallel here with a finding we’ll soon explore at more length: many (especially younger) bisexual people do not stop identifying as bisexual even if they’re in an exclusive long-term relationship with a man or woman. Here and elsewhere, identity is more typically associated with a minority behavior than with the majority—which makes sense, since the majority, being a default, doesn’t need any separate community, language, or culture. As we’ll explore in the following chapters, personal identity has become increasingly distinct from behavior, especially in urban settings. Uncoupling identity from behavior opens the door to many combinations of responses that can appear contradictory by a more literal, purely behavioral standard.
Why do minority labels, cultures, and identities exist, if they aren’t reflected in people’s behaviors? Put another way, why would anyone feel the need to signal that they are a card-carrying member of a club they may never intend to set foot in?
Some critics find such signaling performative and annoying. The harshest critique tends to come from people within those communities, who may feel that “non-practicing members” are posers, talking the talk but not walking the walk—and, perhaps, not paying the price of admission. Such “gatekeeping” can feel painful, as for this 31-year-old from Woodridge, New York: “Because I’m in a heterosexual marriage people assume that my queerness is not real or genuine and this makes me feel invalid and lost in the queer community. Almost erased.”
As a consequence—beyond individual feelings of erasure by the excluded or dilution by “practicing members”—invisibility can make the prevalence of an identity trait hard to guess. How many queer or bisexual people are there, really?
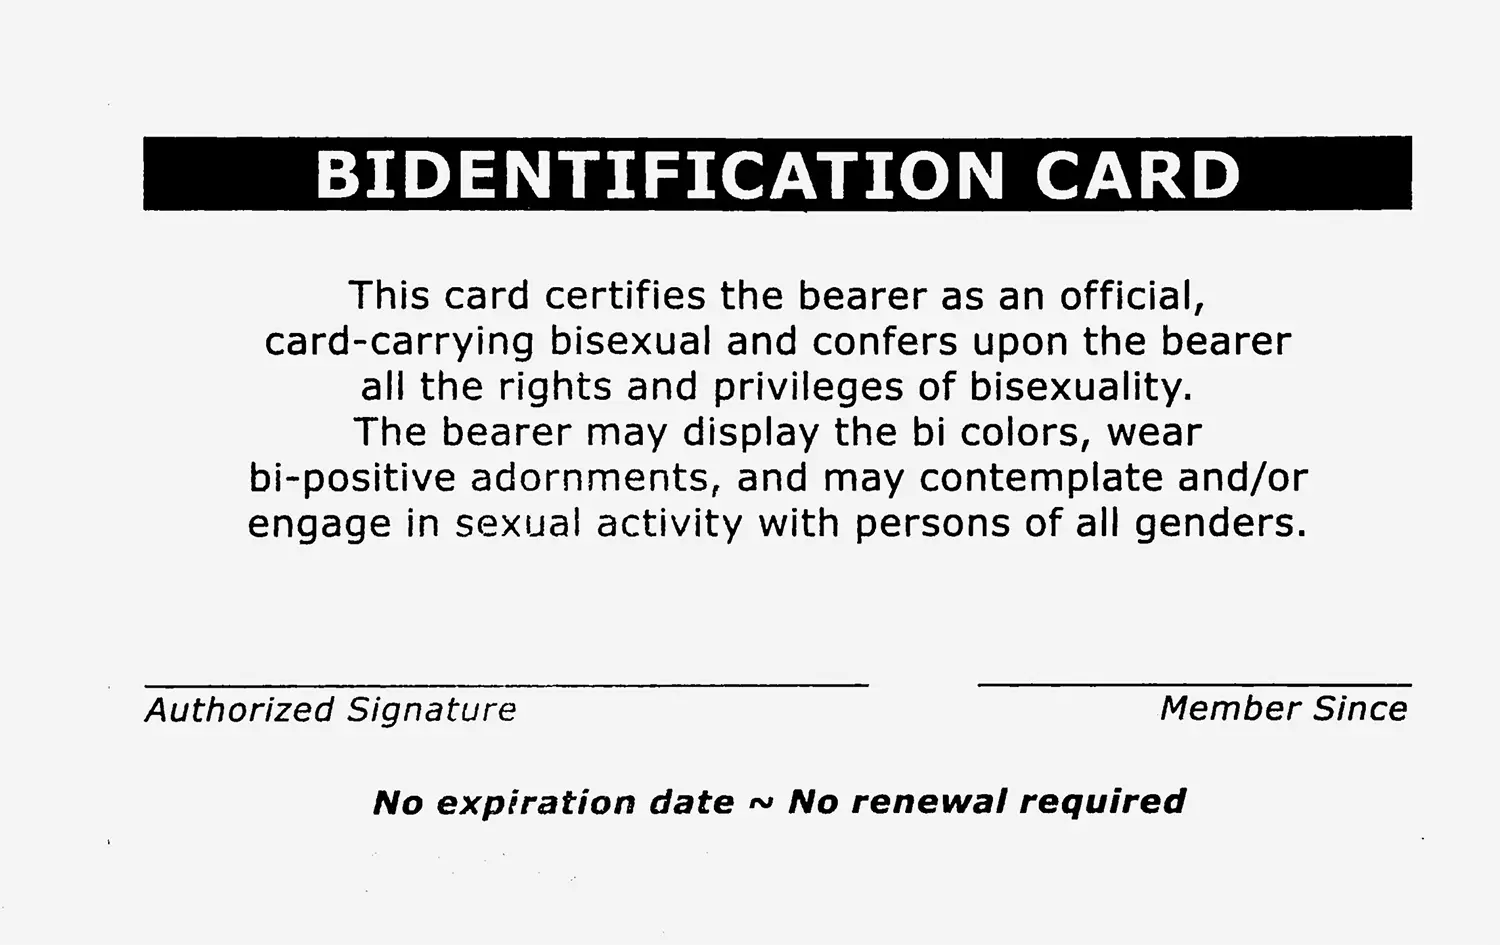
The answer will vary dramatically depending on whether we count only those who are “practicing” or include everyone who identifies as such. Hence our choice of questions to ask, and the way we interpret responses, can change our perspective on a phenomenon dramatically. It can even make the difference between a minority and a majority.
Some of these data are from a parallel population survey I ran in 2020 asking 12,000 respondents, among other questions, how many children and siblings they had.
If you’re a data nerd, you may recognize these numbers as a half, one, two, and three standard deviations or “sigmas.” I make no assumption here, though, that the data are “normally distributed” or follow a bell curve (in fact they can’t, since it’s not possible to have fewer than zero children).
I was careful to frame the questions being graphed here as precisely as possible. As we’ll explore in Chapter 11, being assigned female at birth isn’t a guarantee of having a uterus, let alone of being fertile, but for these purposes it’s a reasonable proxy. The “Born to those assigned female at birth” curve plots responses to “How many children have you personally given birth to?” for those unambiguously assigned female at birth. “Claimed by those assigned male at birth” plots responses to “How many children do you have?” for those unambiguously assigned male at birth. Using only “How many children do you have?” for both sexes, and relying on “Are you female?” and “Are you male?” produces very similar curves, though.
Surrogate pregnancies are such an exception; however, they account for significantly fewer than one in 1,000 births today.
Osterman et al., “Births: Final Data for 2020,” 2022.
Schweizer, Valerie, “Marriage: More than a Century of Change, 1900-2018,” 2020; Allred, “Marriage: More than a Century of Change, 1900-2016,” 2018.
Ausubel, “Globally, Women Are Younger than Their Male Partners, More Likely to Age Alone,” 2020.
There are many other 19th and 20th century formulations, but this one is from Locker-Lampson, Patchwork, 1879.
Manzoli et al., “Marital Status and Mortality in the Elderly: A Systematic Review and Meta-Analysis,” 2007; Jia and Lubetkin, “Life Expectancy and Active Life Expectancy by Marital Status Among Older U.S. Adults: Results from the U.S. Medicare Health Outcome Survey (HOS),” 2020.
Klein and Flanagan, “Sex Differences in Immune Responses,” 2016; Oertelt-Prigione, “The Influence of Sex and Gender on the Immune Response,” 2012; Caruso et al., “Sex, Gender and Immunosenescence: A Key to Understand the Different Lifespan Between Men and Women?,” 2013.
Hrdy, Mothers and Others: The Evolutionary Origins of Mutual Understanding, chap. 3, 2009.
Hamilton, “The Moulding of Senescence by Natural Selection,” 1966.
This figure is fairly consistent with other studies. Haupert et al., “Prevalence of Experiences With Consensual Nonmonogamous Relationships: Findings From Two National Samples of Single Americans,” 2017; Rubin et al., “On the Margins: Considering Diversity Among Consensually Non-Monogamous Relationships,” 2014; Conley et al., “The Fewer the Merrier?: Assessing Stigma Surrounding Consensually Non-Monogamous Romantic Relationships,” 2013.
Ortiz-Ospina and Roser, “Marriages and Divorces,” 2020.
Perel, Mating in Captivity: Sex, Lies and Domestic Bliss, 2007; Barker, Rewriting the Rules: An Integrative Guide to Love, Sex and Relationships, 2012; Savage, American Savage: Insights, Slights, and Fights on Faith, Sex, Love, and Politics, 2013; Fern, Polysecure: Attachment, Trauma and Consensual Nonmonogamy, 2020.
Quoted at greater length in Chapter 4: Ryan, The Philosophy of Marriage, 91, 1837.
Conley, Ziegler, and Moors, “Backlash From the Bedroom: Stigma Mediates Gender Differences in Acceptance of Casual Sex Offers,” 2013.
The term was coined by researchers who claimed to have found evidence of Genghis Khan’s Y chromosome, though this is contested. See Wei et al., “Whole-Sequence Analysis Indicates That the Y Chromosome C2*-Star Cluster Traces Back to Ordinary Mongols, Rather Than Genghis Khan,” 2018.
Pollet et al., “The Golden Years: Men from the Forbes 400 Have Much Younger Wives When Remarrying than the General US Population,” 2013.
In a number of studies, men have reported having about twice as many opposite-sex sexual partners as women on average, which on its face seems inconsistent. There are a number of likely causes, including social stigma, but also other factors—such as missing or underreported data from sex workers, most of whom are women catering to men. Mitchell et al., “Why Do Men Report More Opposite-Sex Sexual Partners Than Women? Analysis of the Gender Discrepancy in a British National Probability Survey,” 2019.
Also known as: cheating.


